
2019 · Frontiers in Psychology · 10, 2215
Journal DOI: 10.3389/fpsyg.2019.02215 Open access
Abstract
Generalized structured component analysis (GSCA) is a theoretically well-founded approach to component-based structural equation modeling (SEM). This approach utilizes the bootstrap method to estimate the confidence intervals of its parameter estimates without recourse to distributional assumptions, such as multivariate normality. It currently provides the bootstrap percentile confidence intervals only. Recently, the potential usefulness of the bias-corrected and accelerated bootstrap (BCa) confidence intervals (CIs) over the percentile method has attracted attention for another component-based SEM approach—partial least squares path modeling. Thus, in this study, we implemented the BCa CI method into GSCA and conducted a rigorous simulation to evaluate the performance of three bootstrap CI methods, including percentile, BCa, and Student's t methods, in terms of coverage and balance. We found that the percentile method produced CIs closer to the desired level of coverage than the other methods, while the BCa method was less prone to imbalance than the other two methods. Study findings and implications are discussed, as well as limitations and directions for future research.
Version of record · Abstract source · CC BY 4.0
Figures 9 images
Select an image to view it at full size. Captions identify the source and version.
Figure 1
Caption & source
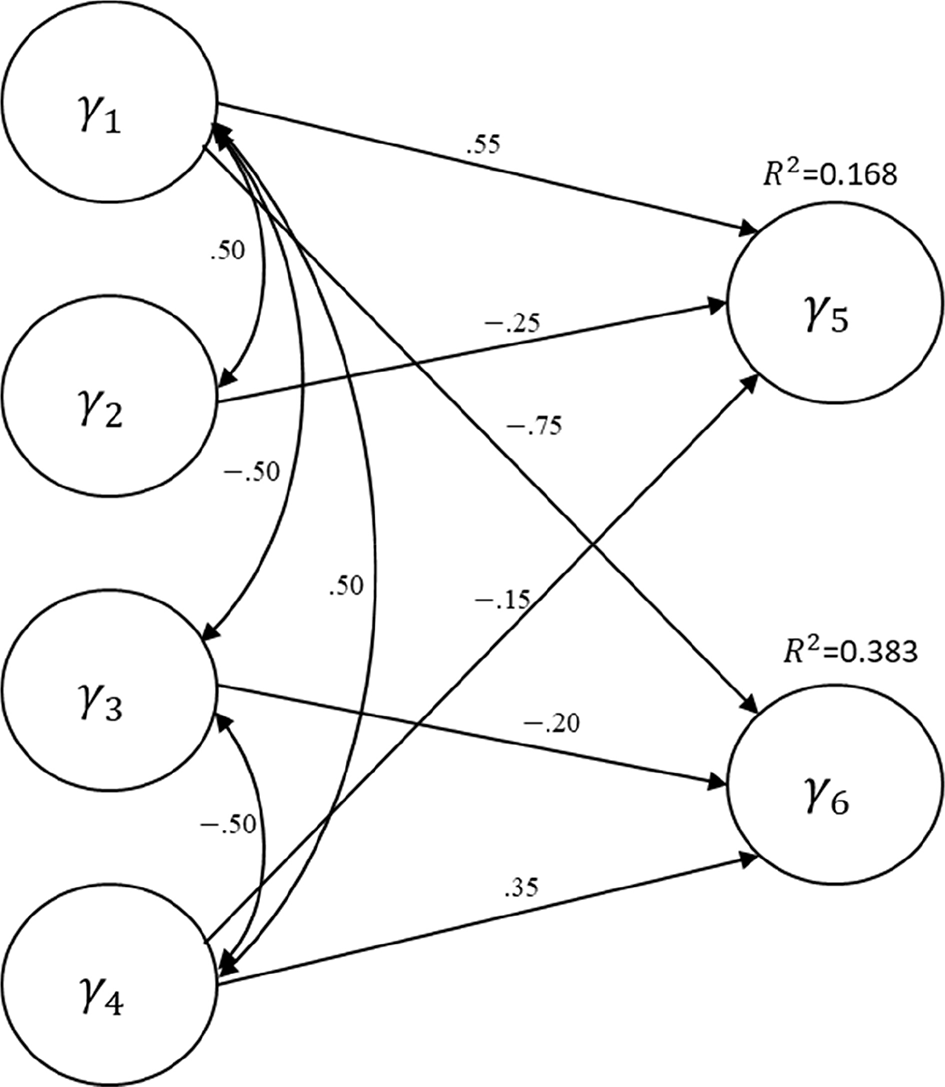
The population structural equation model specified for the simulation study.
Version of record · Figure source · CC BY 4.0
Figure 2
Caption & source
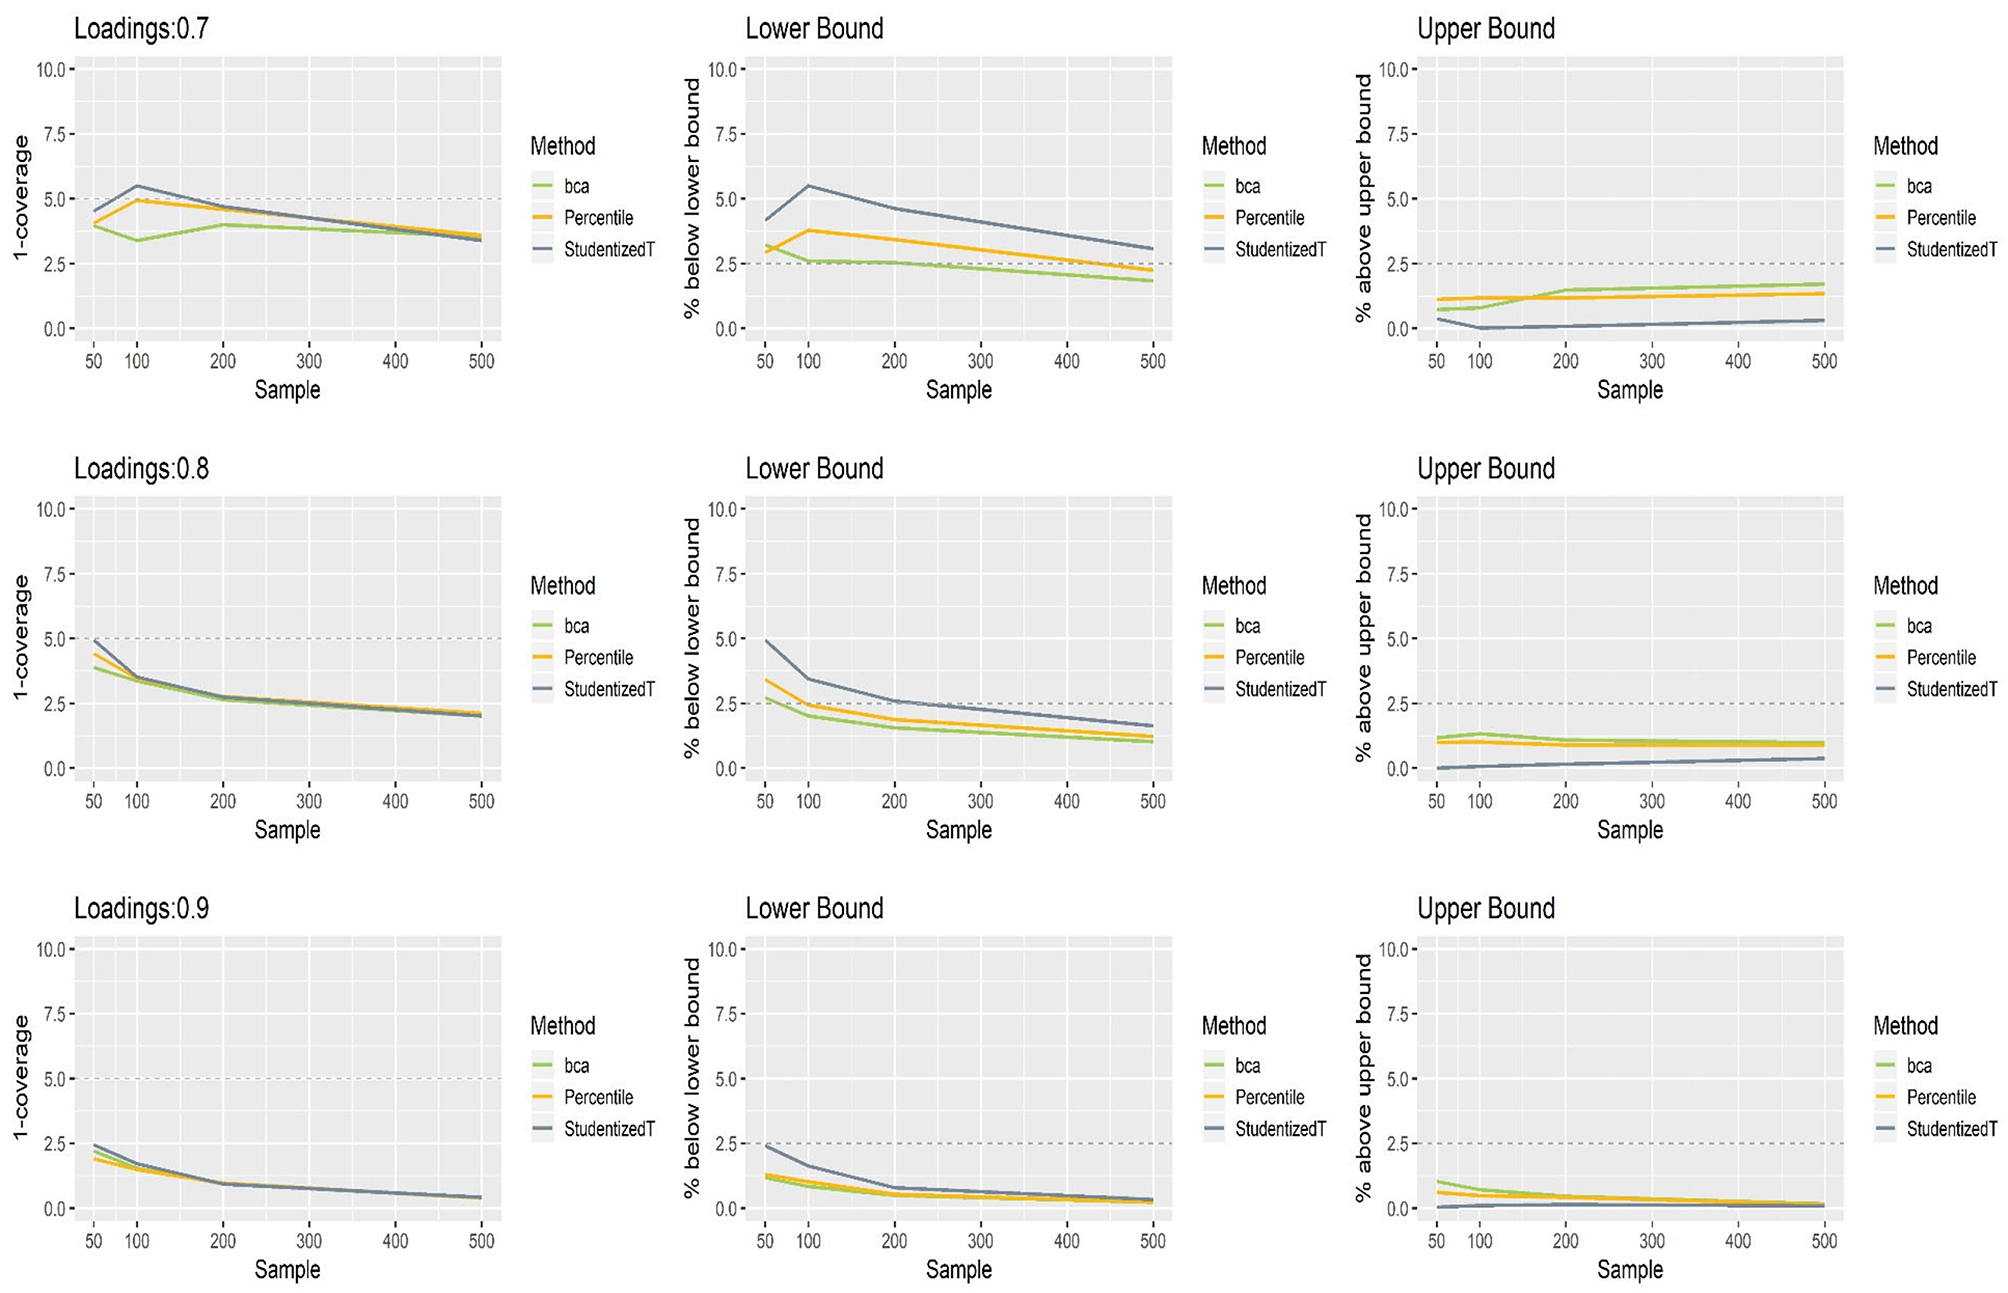
The coverage and balance of percentile, bias-corrected and accelerated bootstrap (BCa), and Student's t 95% confidence intervals (CIs) of 0.7, 0.8, and 0.9 loadings for normal indicators.
Version of record · Figure source · CC BY 4.0
Figure 3
Caption & source
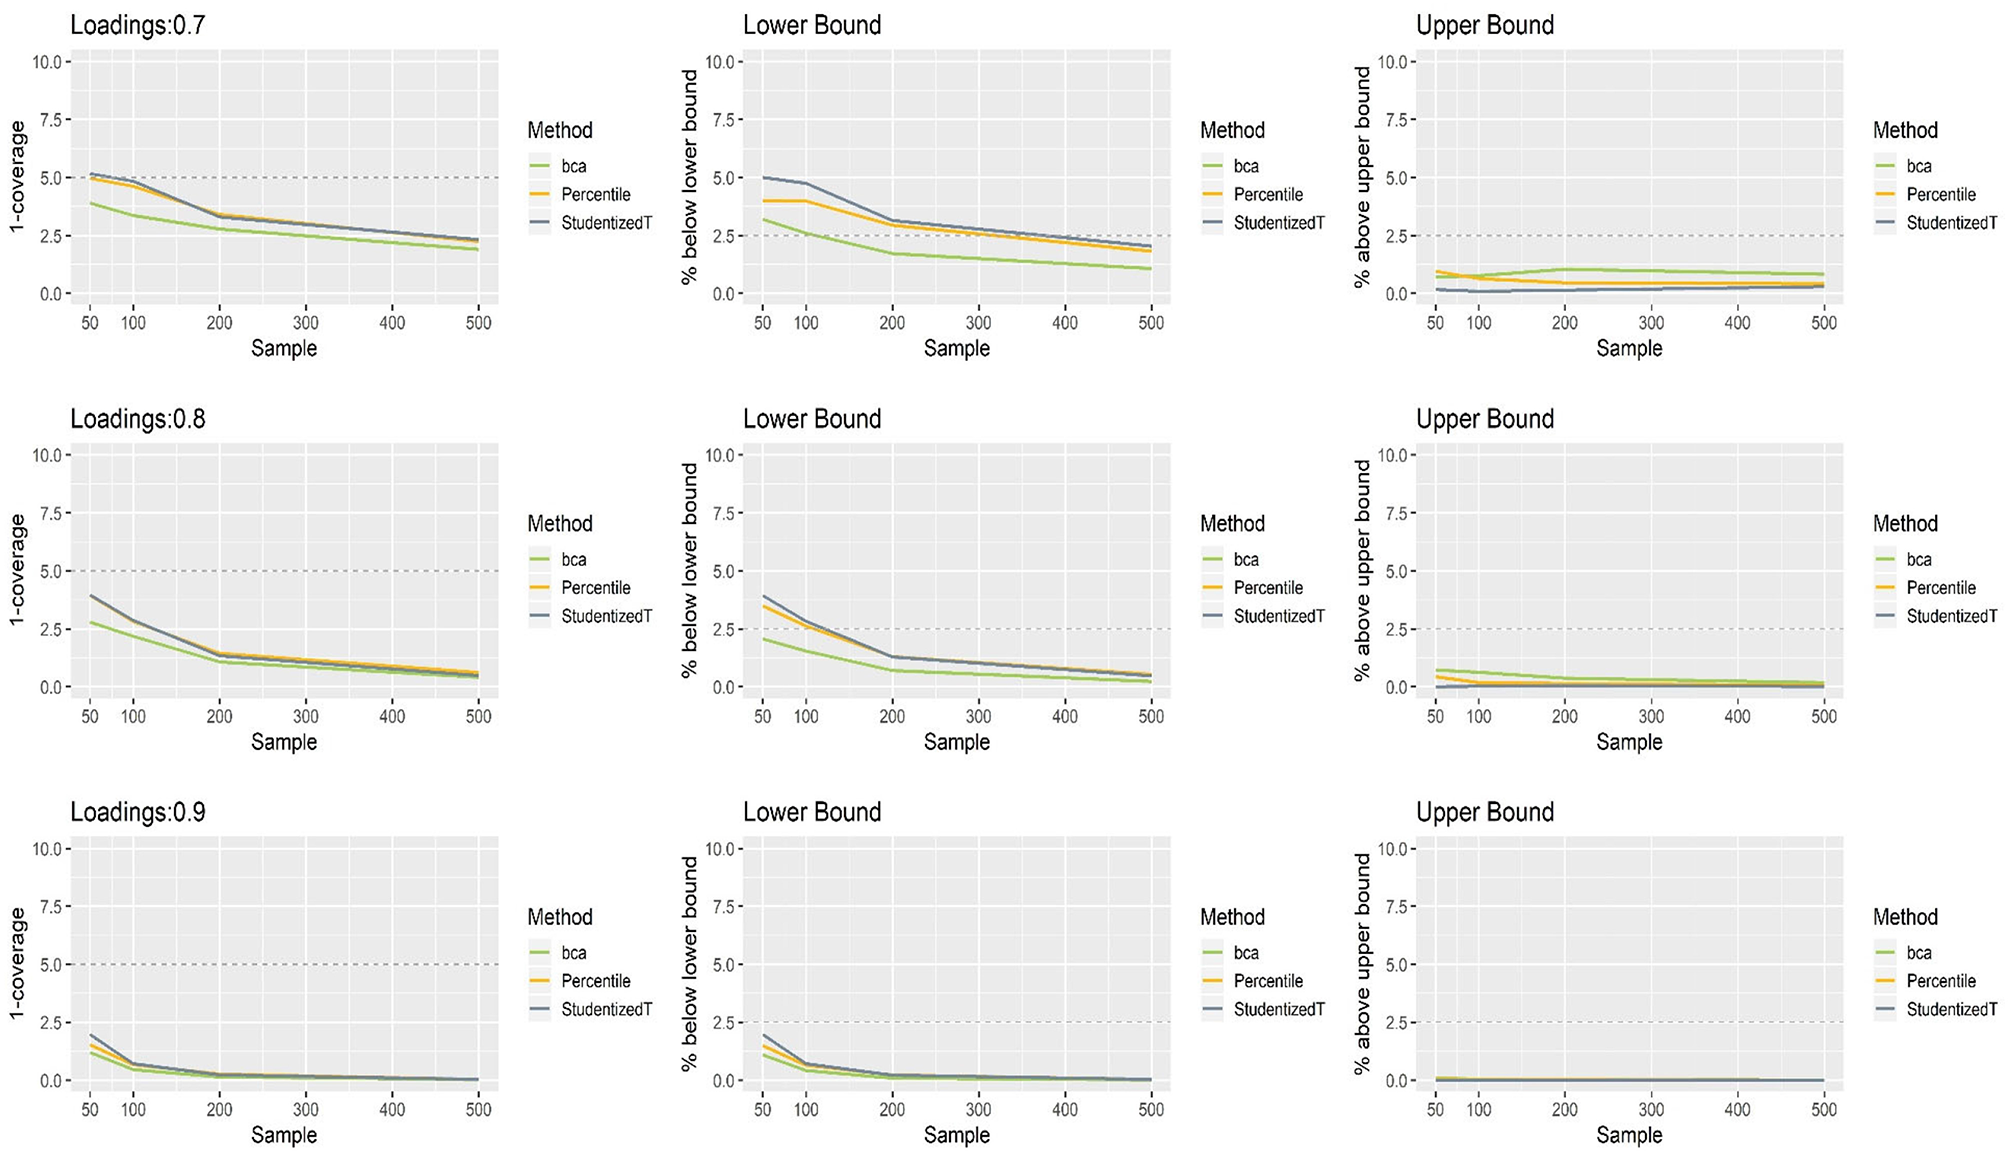
The coverage and balance of percentile, bias-corrected and accelerated bootstrap (BCa), and Student's t 95% confidence intervals (CIs) of 0.7, 0.8, and 0.9 loadings for non-normally distributed indicators.
Version of record · Figure source · CC BY 4.0
Figure 4
Caption & source
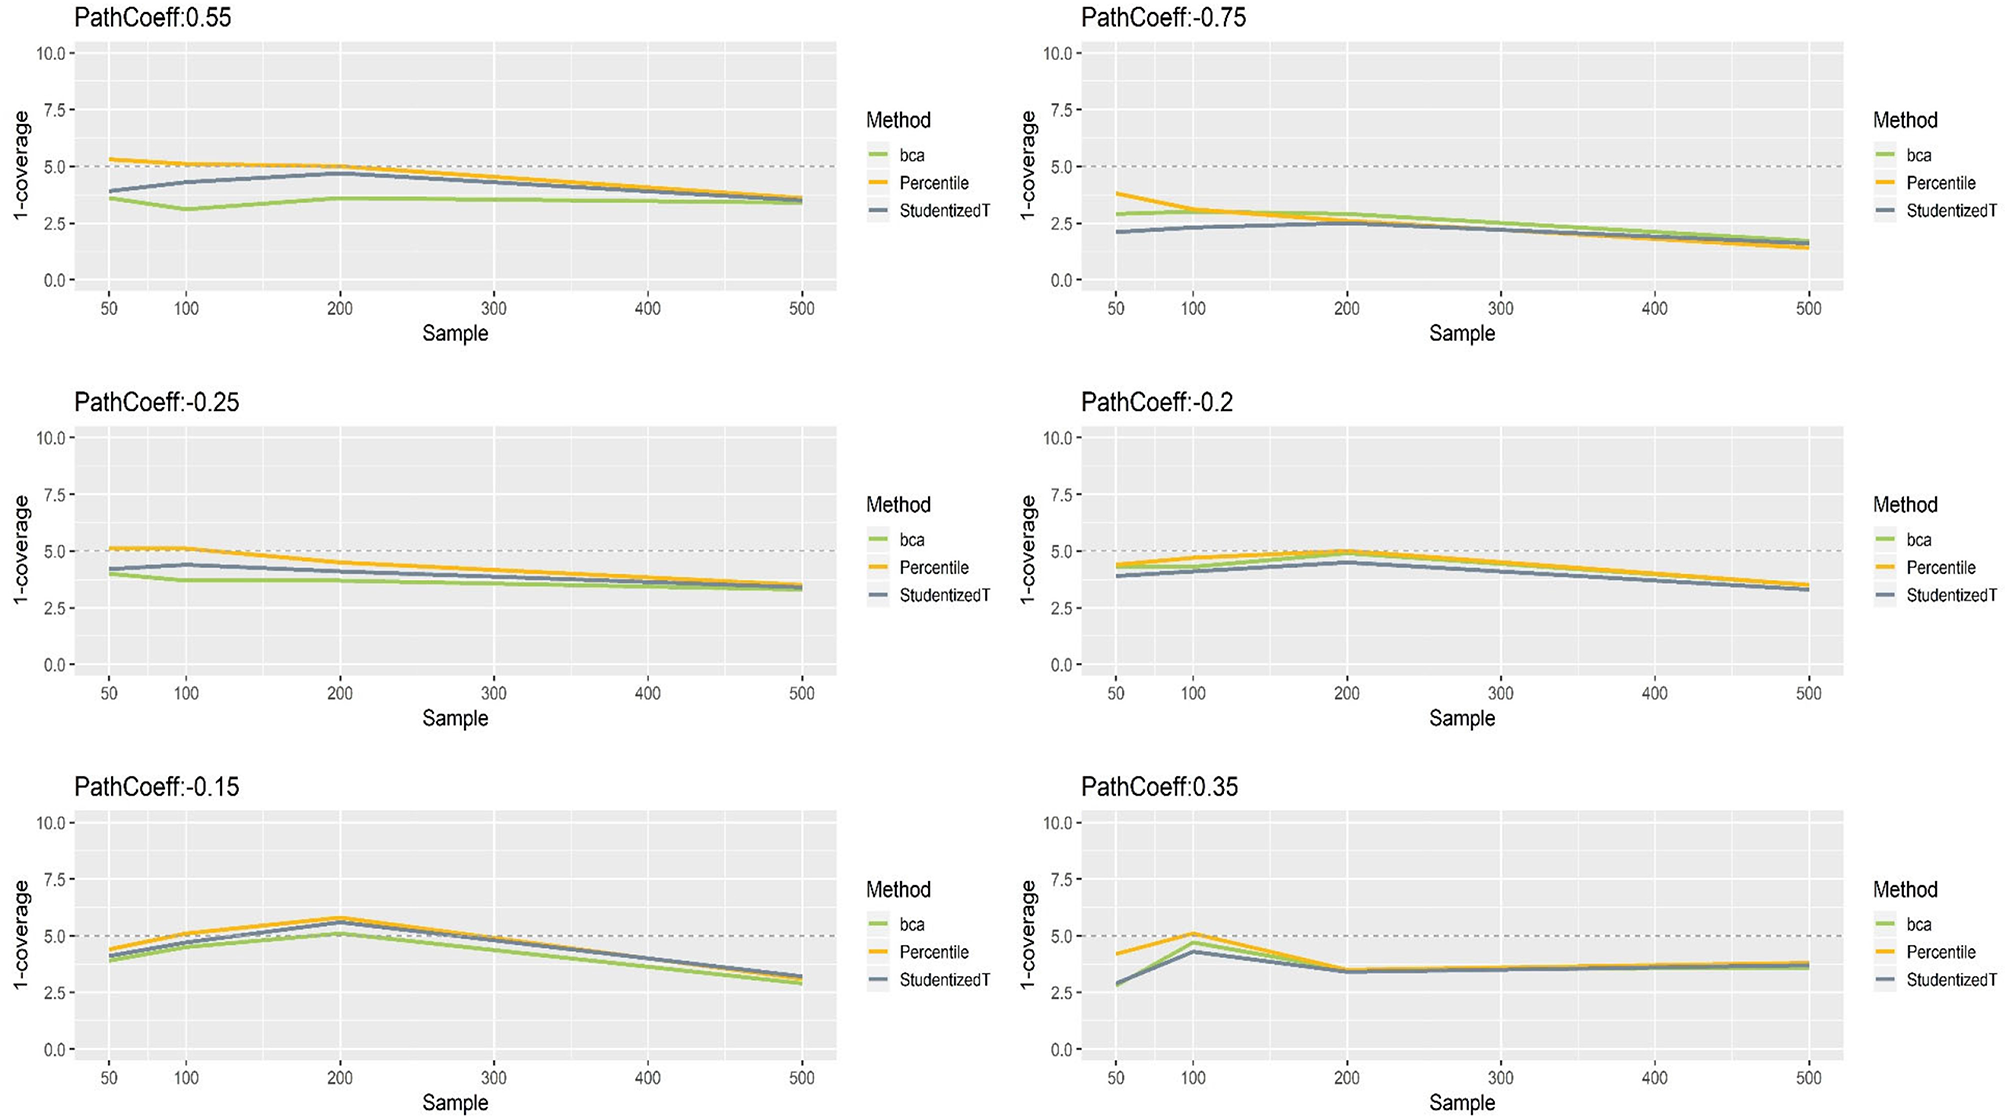
The coverage of percentile, bias-corrected and accelerated bootstrap (BCa), and Student's t 95% confidence intervals (CIs) of path coefficients in the normal indicator condition.
Version of record · Figure source · CC BY 4.0
Figure 5
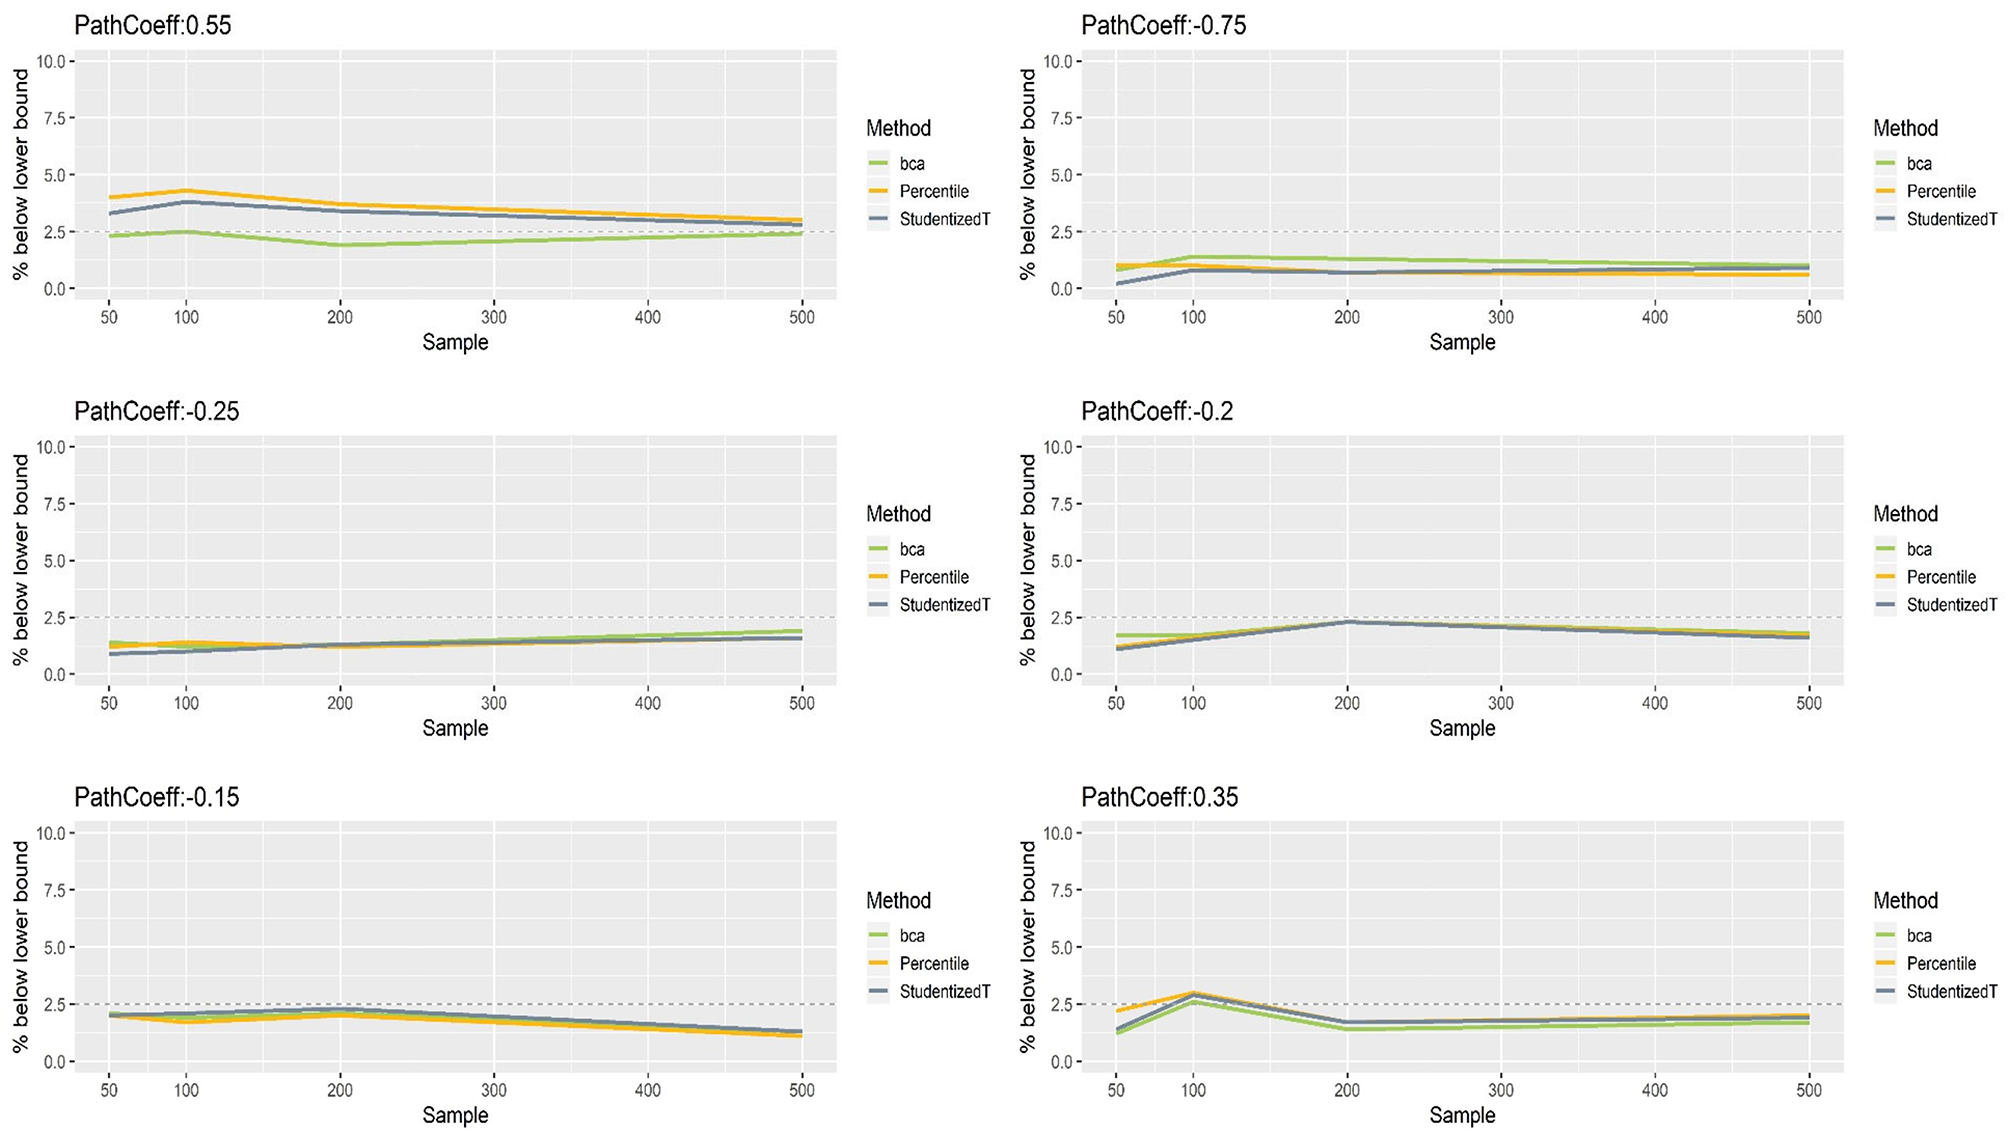
Caption & source
The lower limits of percentile, bias-corrected and accelerated bootstrap (BCa), and Student's t 95% confidence intervals (CIs) of path coefficients in the normal indicator condition.
Version of record · Figure source · CC BY 4.0
Figure 6
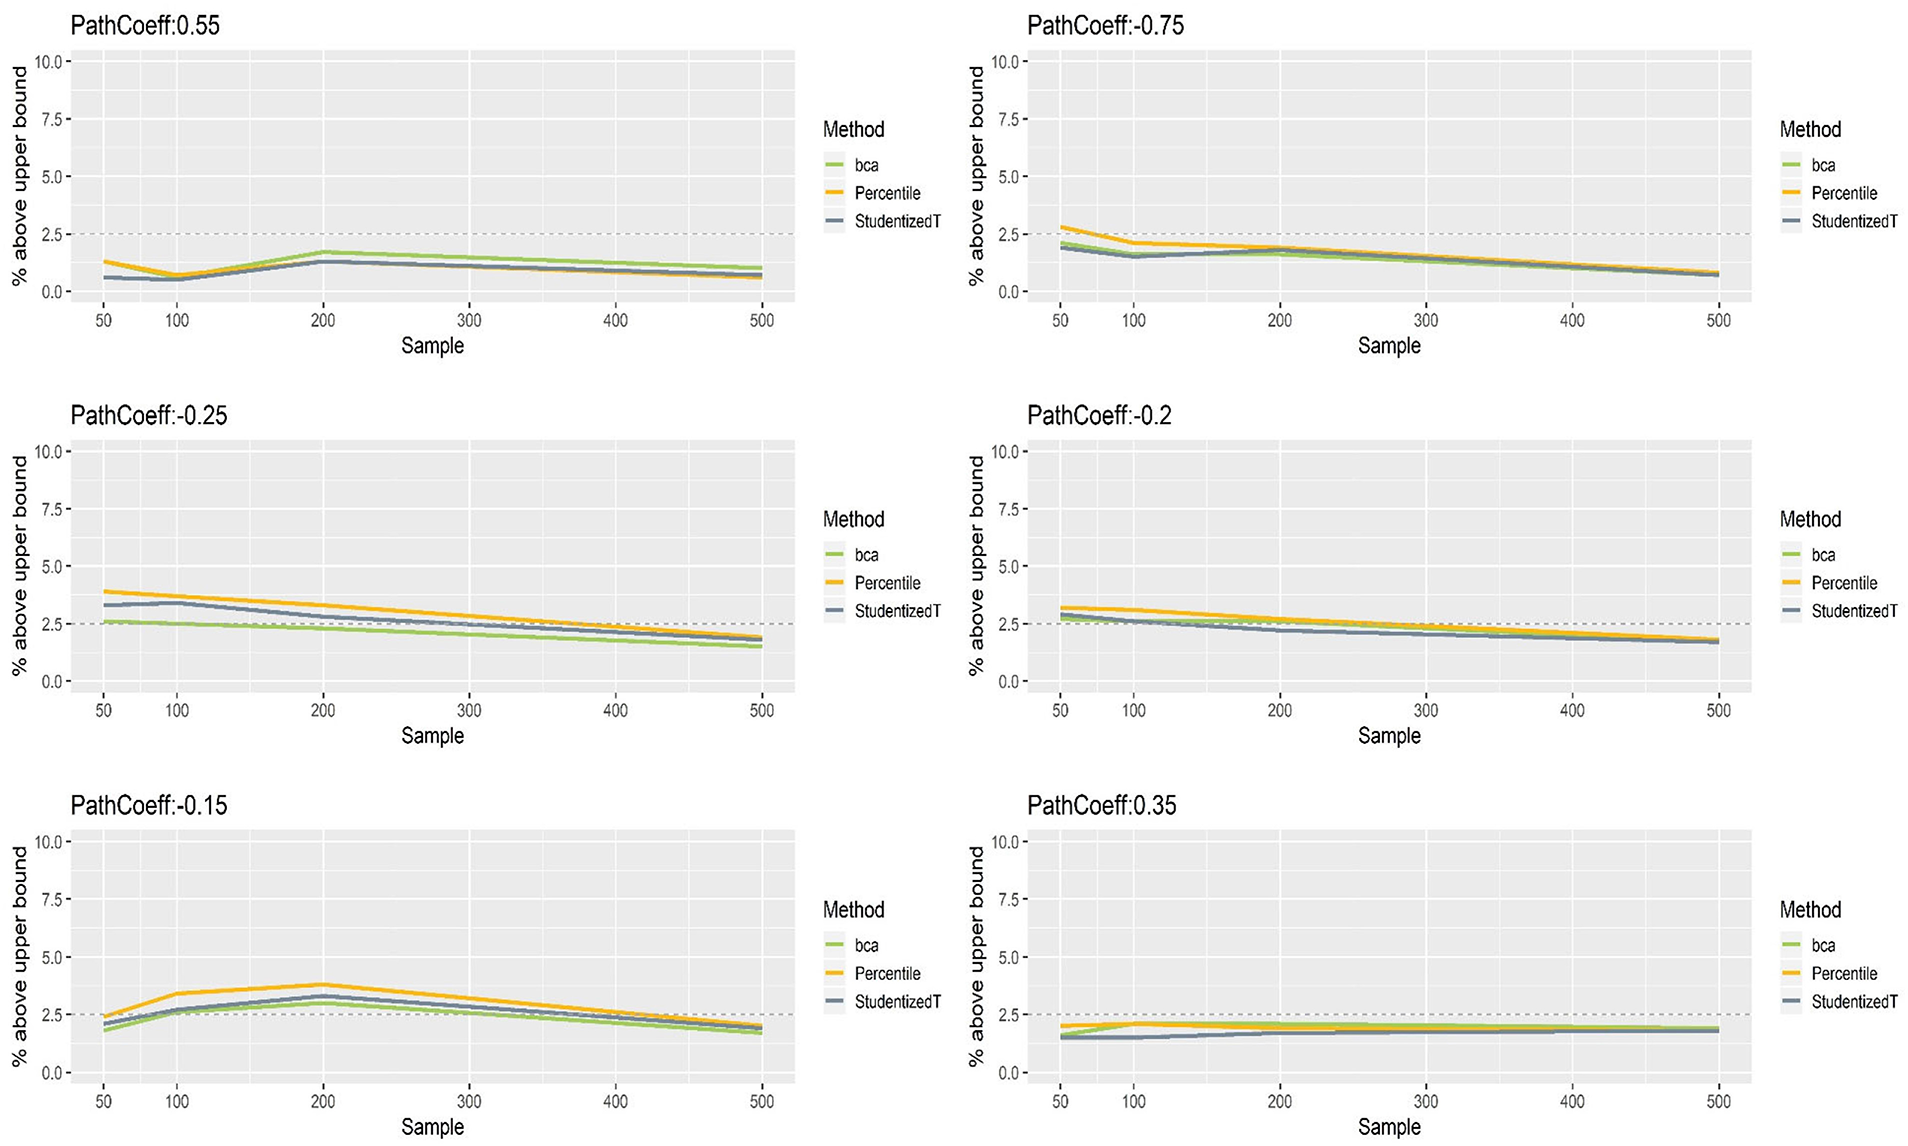
Caption & source
The upper limits of percentile, bias-corrected and accelerated bootstrap (BCa), and Student's t 95% confidence intervals (CIs) of path coefficients in the normal indicator condition.
Version of record · Figure source · CC BY 4.0
Figure 7
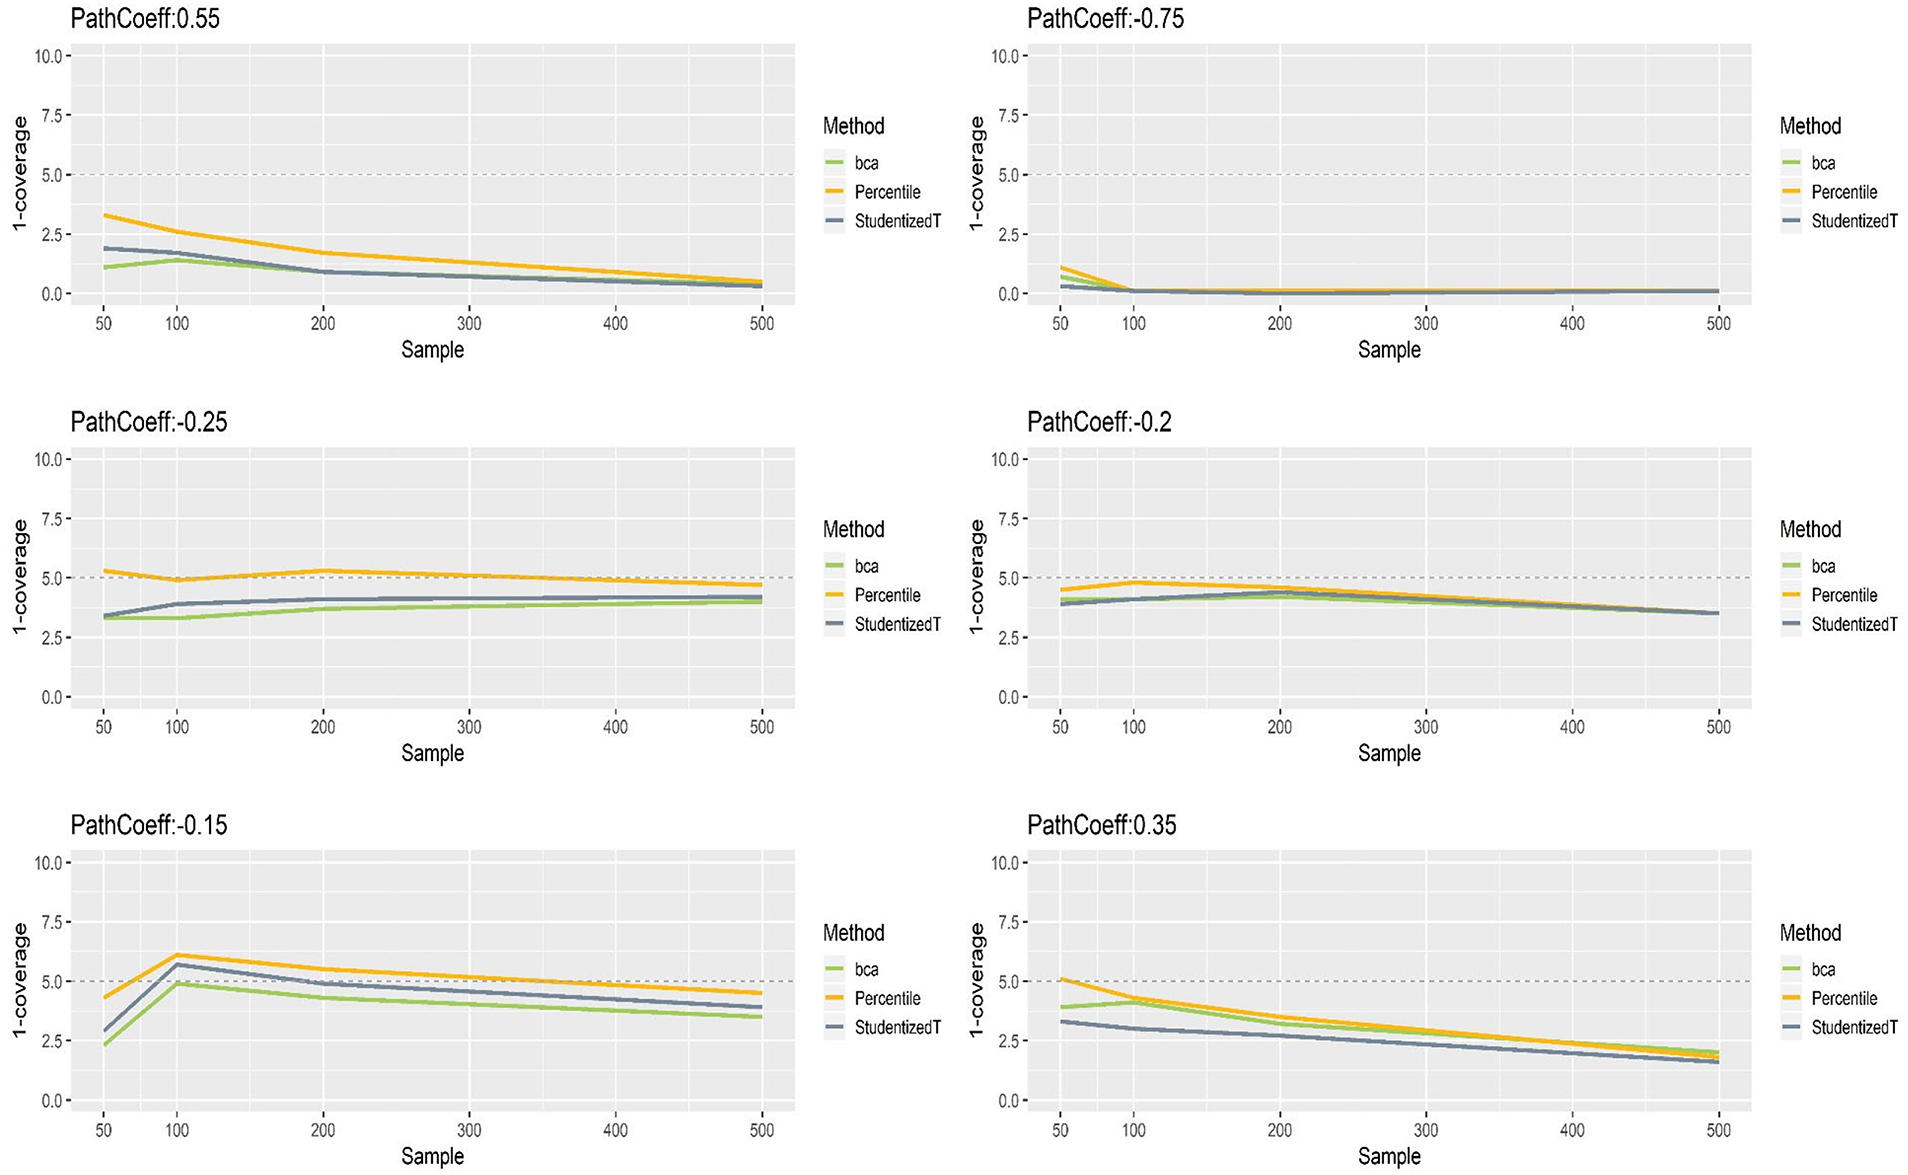
Caption & source
The coverage of percentile, BCa, and Student's t 95% CIs of path coefficients in the non-normally distributed indicator condition.
Version of record · Figure source · CC BY 4.0
Figure 8
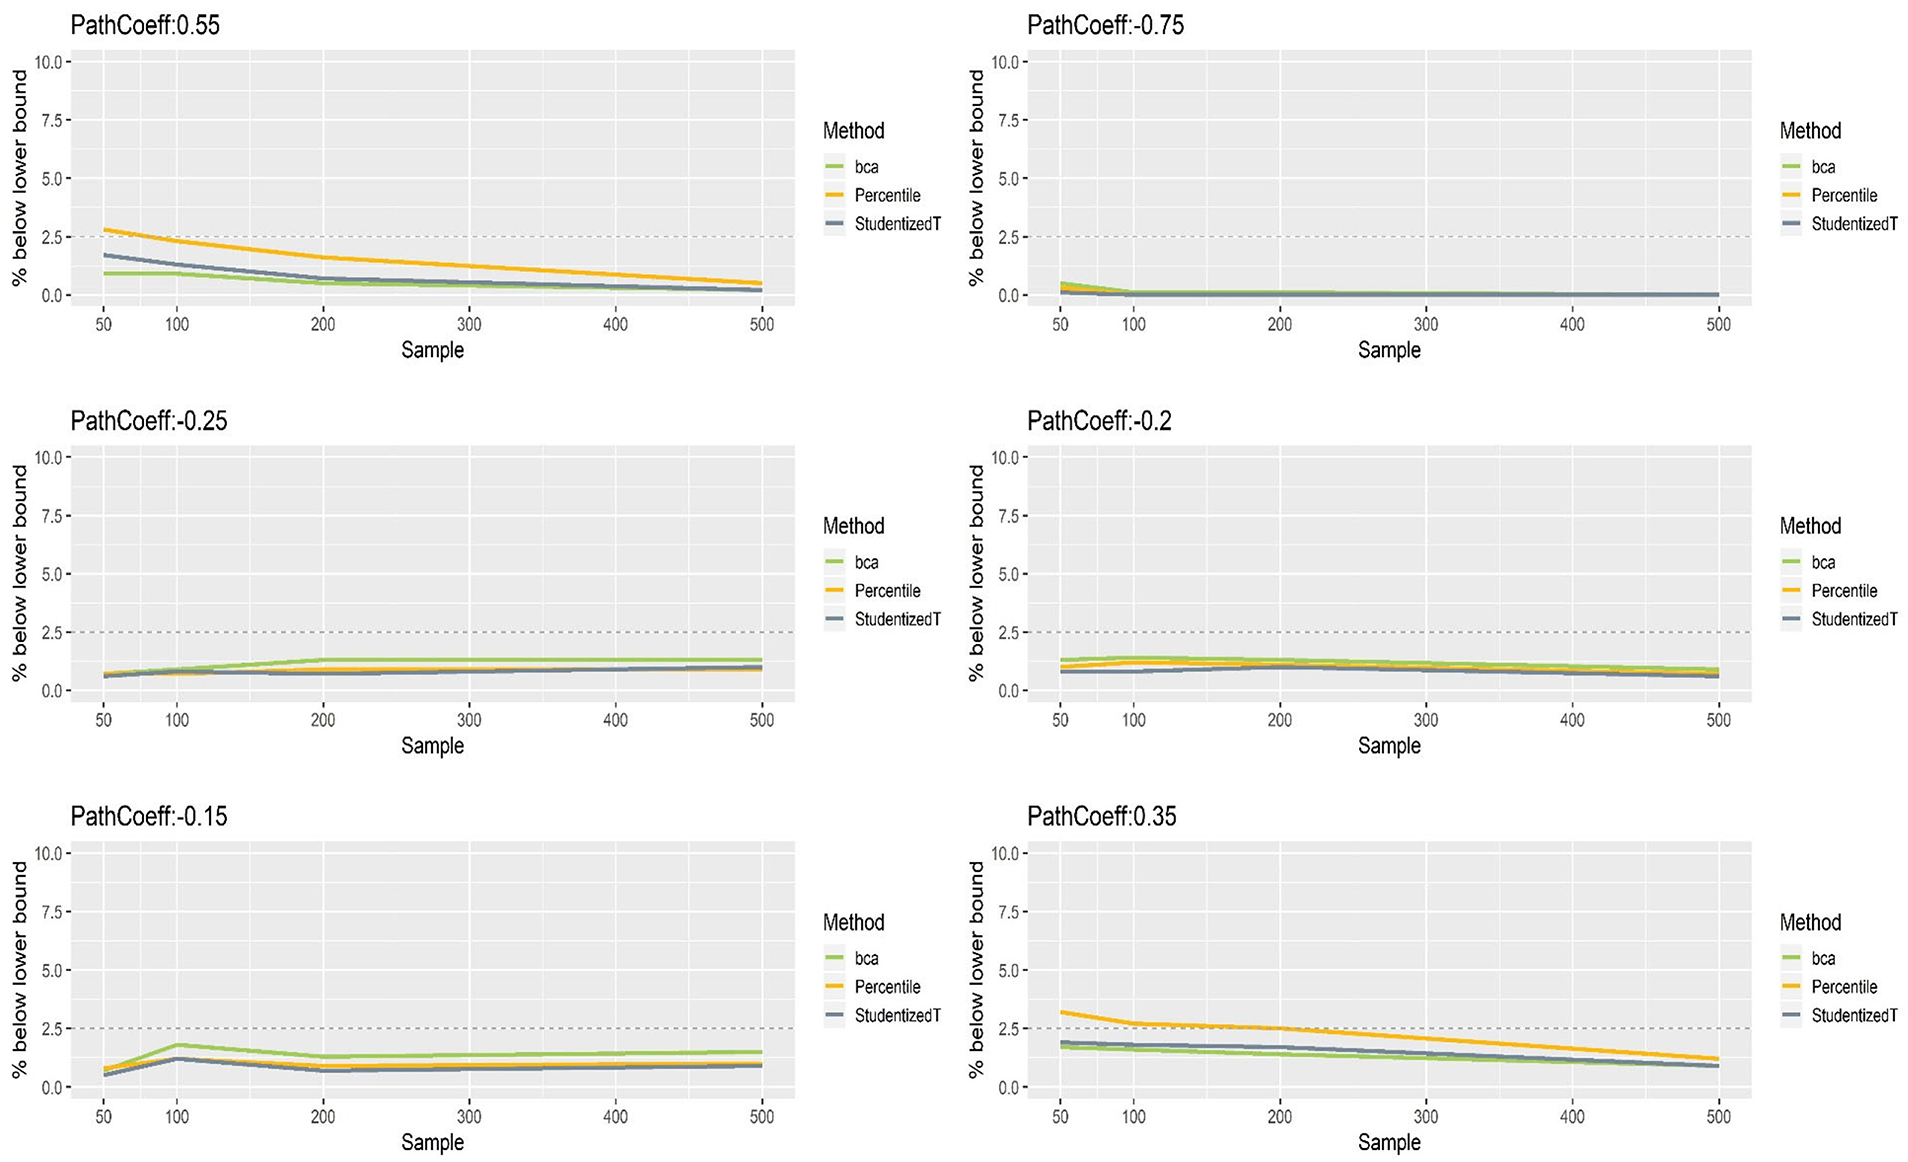
Caption & source
The lower limits of percentile, bias-corrected and accelerated bootstrap (BCa), and Student's t 95% confidence intervals (CIs) of path coefficients in the non-normally distributed indicator condition.
Version of record · Figure source · CC BY 4.0
Figure 9
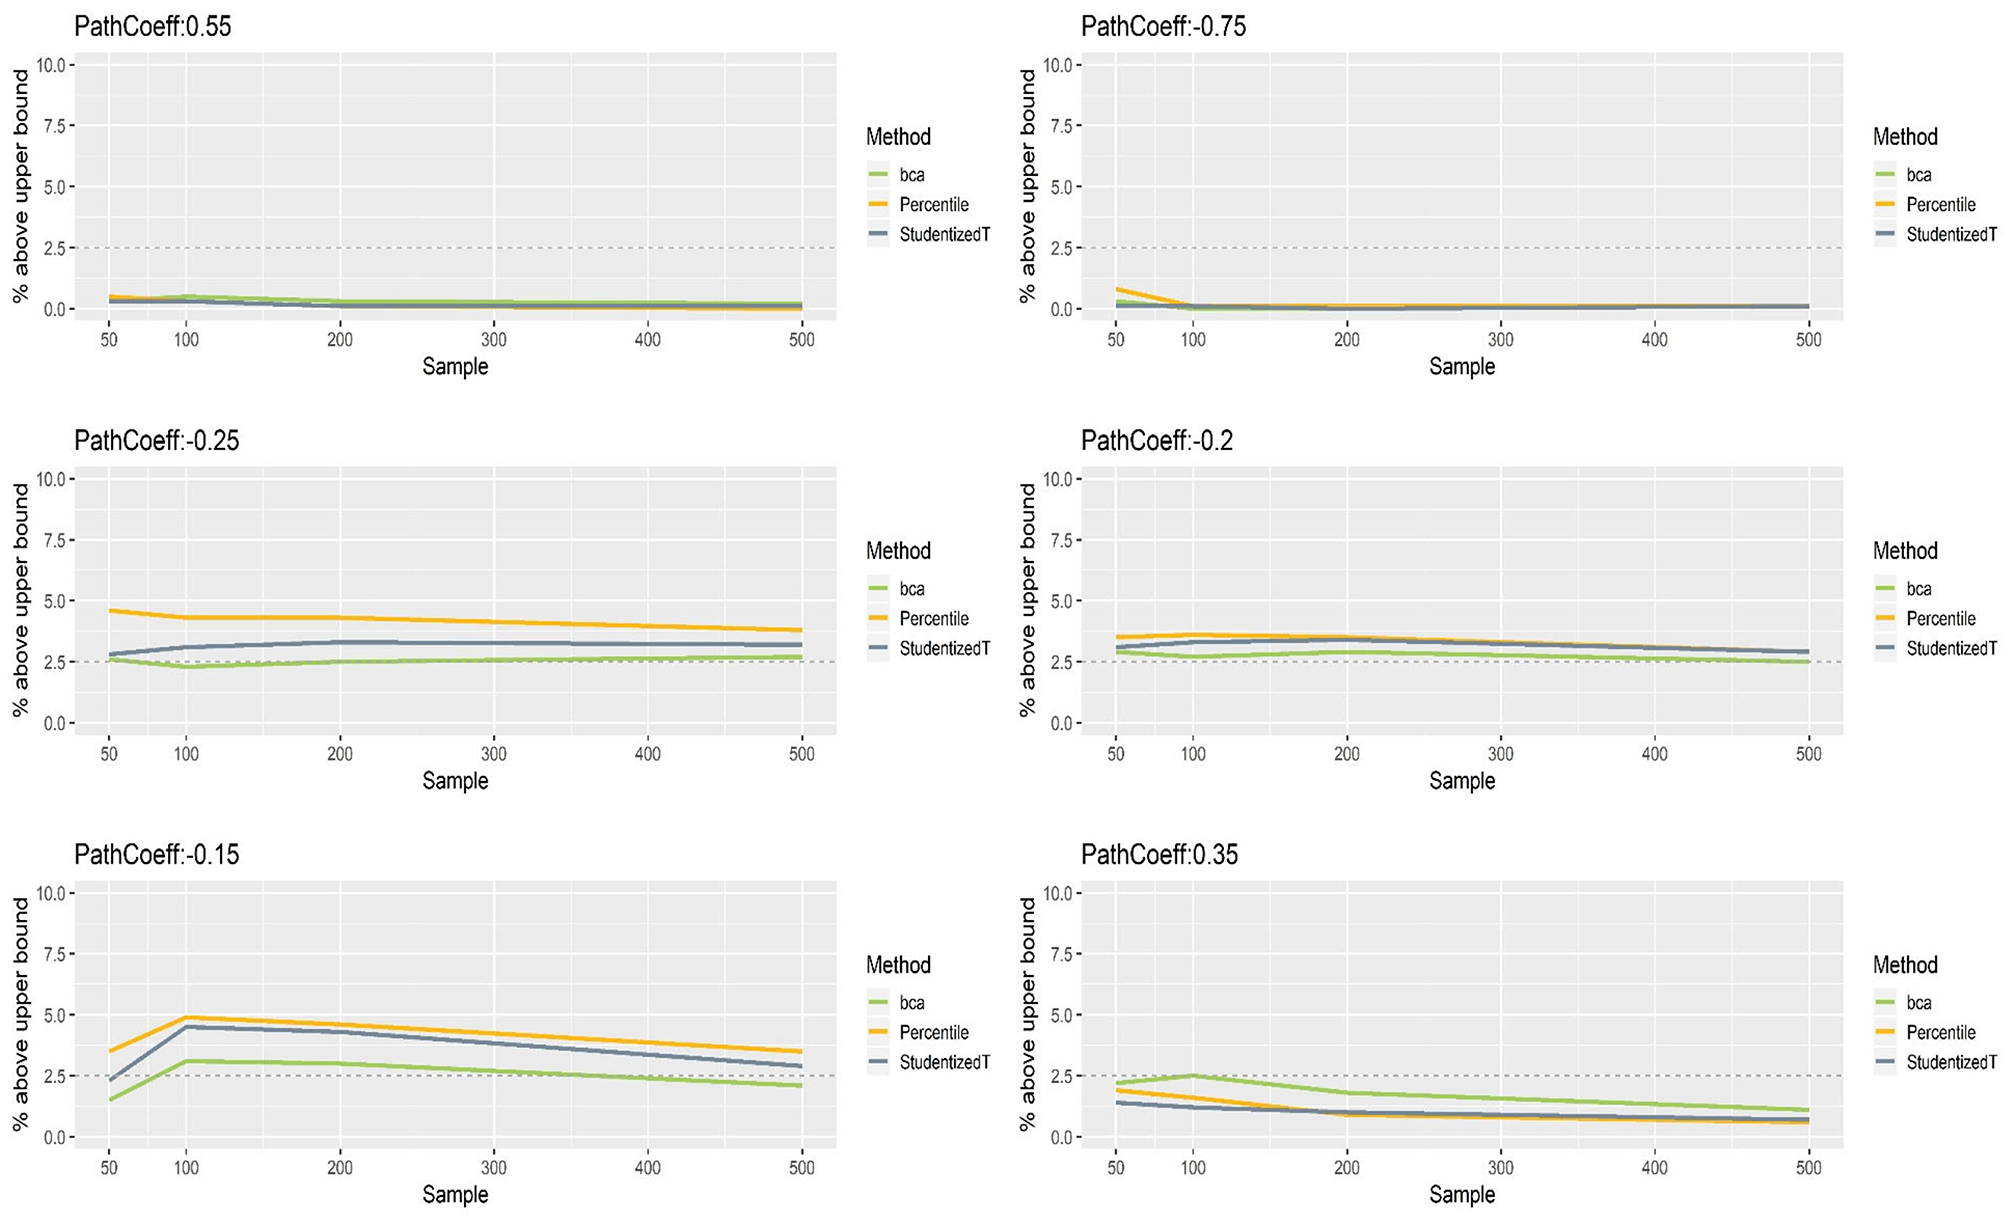
Caption & source
The upper limits of percentile, bias-corrected and accelerated bootstrap (BCa), and Student's t 95% confidence intervals (CIs) of path coefficients in the non-normally distributed indicator condition.
Version of record · Figure source · CC BY 4.0
Versions & resources
Peer-reviewed journal article
Frontiers in Psychology · 2019
DOI: 10.3389/fpsyg.2019.02215Cite this work
Jung, K., Lee, J., Gupta, V., & Cho, G. (2019). Comparison of bootstrap confidence interval methods for GSCA using a Monte Carlo simulation. Frontiers in Psychology, 10, 2215. https://doi.org/10.3389/fpsyg.2019.02215