
2018 · Psychiatry Investigation · 15(11), 1053–1063
Journal DOI: 10.30773/pi.2018.09.27.2 Open access
Abstract
Objective
This study evaluated the psychometric properties of the Korean Anxiety Screening Assessment (K-ANX) developed for screening anxiety disorders.
Methods
Data from 613 participants were analyzed. The K-ANX was evaluated for reliability using Cronbach’s alpha, item-total correlation, and test information curve, and for validity using focus group interviews, factor analysis, correlational analysis, and item characteristics based on item response theory (IRT). The diagnostic sensitivity and specificity of the K-ANX were compared with those of the Beck Anxiety Inventory (BAI) and Generalized Anxiety Disorder 7-item scale (GAD-7).
Results
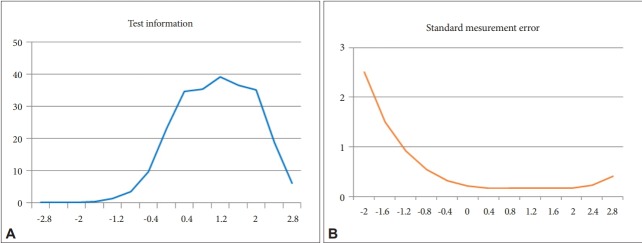
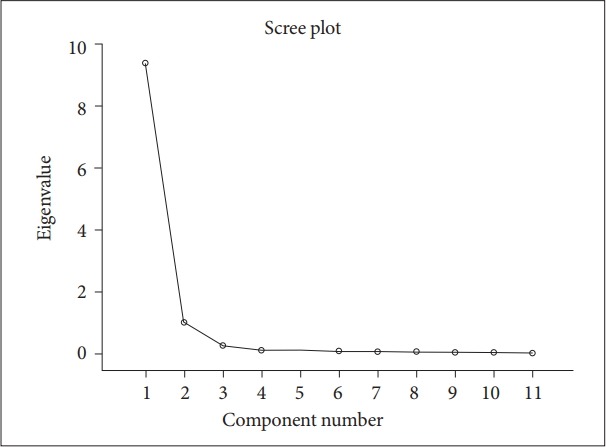
The K-ANX showed excellent internal consistency (α=0.97) and item-total coefficients (0.92–0.97), and a one-factor structure was suggested. All items were highly correlated with the total scores of the BAI, GAD-7, and Penn State Worry Questionnaire. IRT analysis indicated the K-ANX was most informative as a screening tool for anxiety disorders at the range between 0.8 and 1.6 (i.e., top 21.2 to 5.5 percentiles). Higher sensitivity (0.795) and specificity (0.937) for identifying anxiety disorders were observed in the K-ANX compared to the BAI and GAD-7.
Conclusion
The K-ANX is a reliable and valid measure to screen anxiety disorders in a Korean sample, with greater sensitivity and specificity than current measures of anxiety symptoms.
Version of record · Abstract source · CC BY-NC 4.0
Figures 3 images
Select an image to view it at full size. Captions identify the source and version.
Figure 1
Caption & source
Test information curve (TIC) of the K-ANX (A); standard error of measurement of the K-ANX (B). K-ANX: Korean Anxiety Screening Assessment.
Version of record · Figure source · CC BY-NC 4.0
Figure 2
Caption & source
Scree plot of the K-ANX. K-ANX: Korean Anxiety Screening Assessment.
Version of record · Figure source · CC BY-NC 4.0
Figure 3
Caption & source
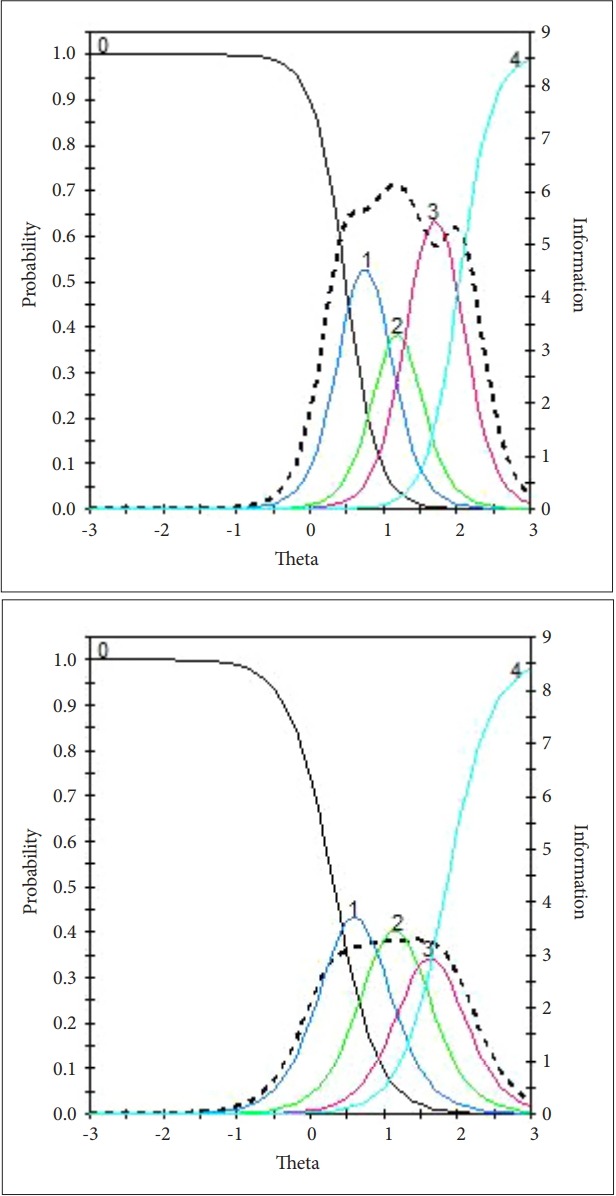
Exemplary category response function (solid lines) and item information function (dotted lines) for item 1 (left) and item 10 (right). The item category response curves for the rest of the items can be provided category response curves at the request of readers.
Version of record · Figure source · CC BY-NC 4.0
Versions & resources
Peer-reviewed journal article
Psychiatry Investigation · 2018
DOI: 10.30773/pi.2018.09.27.2Cite this work
Yeseul Kim, Yeonsoo Park, Gyeongcheol Cho, Kiho Park, Shin-Hyang Kim, Seung Yeon Baik, Cho Long Kim, Sooyun Jung, Won-Hye Lee, Younyoung Choi, Seung-Hwan Lee, & Kee-Hong Choi (2018). Screening tool for anxiety disorders: Development and validation of the Korean Anxiety Screening Assessment. Psychiatry Investigation, 15(11), 1053–1063. https://doi.org/10.30773/pi.2018.09.27.2