
2026
Preprint DOI: 10.21203/rs.3.rs-9990161/v1
Abstract
How life-course experiences shape depression in later life remains one of the central questions in human aging. We analyzed approximately 35 years of sociogenomic longitudinal data from 9,005 European-ancestry individuals in the Wisconsin Longitudinal Study. Machine learning models were applied to 426 variables measured at mean ages 35.6, 53.0, and 64.2 to predict depressive symptoms at mean age 70.6. Psychological resources, including environmental mastery, self-acceptance, purpose in life, and optimism, consistently emerged as the strongest predictors, accounting for substantially greater variance (R² = 0.20) than socioeconomic, behavioral, or genetic factors. Polygenic risk for neuroticism selectively moderated the negative association between the psychological resource composite and late-life depression, supported by linear regression (β = -0.049; 95% CI, -0.075 to -0.024) and generalized structured component analysis (β = -0.037; 95% CI, -0.060 to -0.017). Our findings suggest psychological resource enhancement in genetically vulnerable adults as a potential precision-prevention strategy for late-life depression.
Research Square preprint v1 (10.21203/rs.3.rs-9990161/v1) · Abstract source · CC BY 4.0
Figures 16 images
Select an image to view it at full size. Captions identify the source and version.
Figure 1
Caption & source
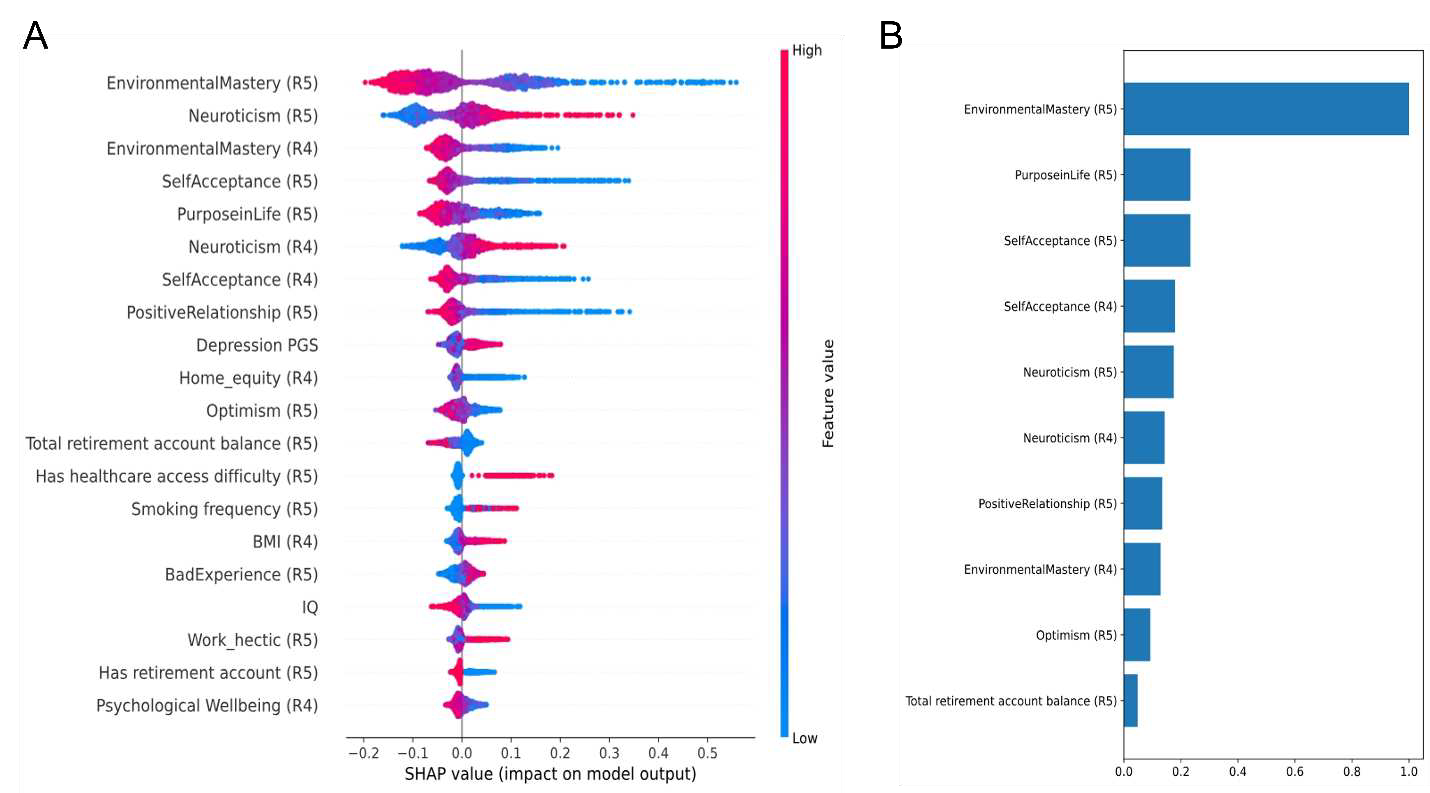
Key variables associated with late-life depression. A, SHAP summary plot showing each feature’s contribution to model predictions. Features are ordered by mean absolute SHAP values. B, Top 10 feature importances. For regression tasks in gradient boosting machines, importance is measured as the total reduction in mean squared error (MSE) attributed to each feature across all splits in the ensemble. The values were scaled to fall between 0 and 1. R5 and R4 denote wave 5 and wave 4.
Research Square preprint v1 (10.21203/rs.3.rs-9990161/v1) · Figure source · CC BY 4.0
Figure 2
Caption & source
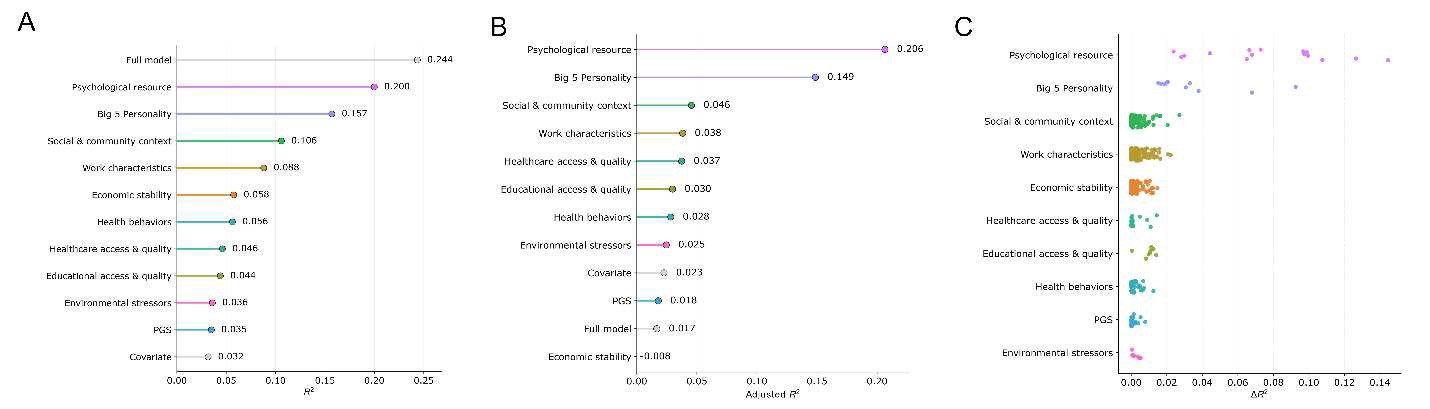
Explained variance across domains and individual variables. A, R² from gradient boosting machine (GBM) models trained separately for each domain and evaluated on the test set. The full model indicates a model with all 426 variables. B, Adjusted R² from generalized linear models (GLMs) fitted separately for each domain on the test set. C, Incremental explained variance (ΔR²) for individual variables estimated from ordinary least squares models. ΔR² was calculated as the difference in R² between models including the variable of interest and a base model including covariates only (sex, age corresponding to the wave of the variable, and the first 10 genetic principal components). Age was not included as a covariate when polygenic risk score (PGS) was the variable of interest.
Research Square preprint v1 (10.21203/rs.3.rs-9990161/v1) · Figure source · CC BY 4.0
Figure 3
Caption & source
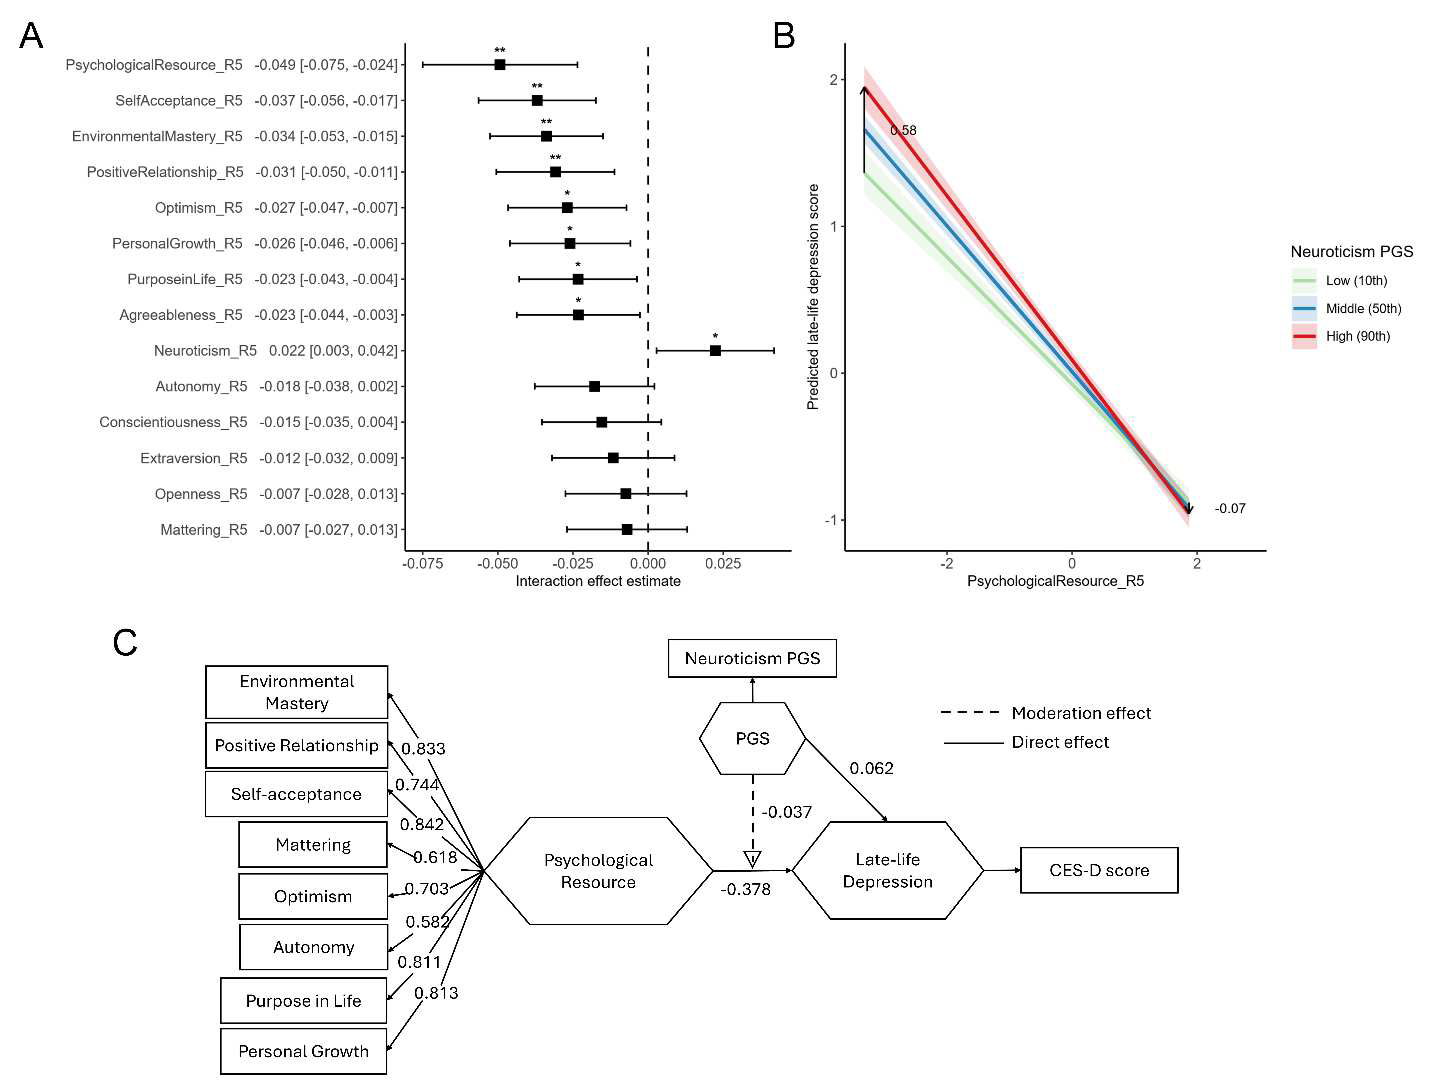
Neuroticism PGS moderates the association between psychological resources and late-life depression. A, Forest plot of interaction effects between neuroticism PGS and key variables (wave 5). Points represent standardized regression coefficients (β) for the interaction terms, and horizontal bars denote 95% confidence intervals. P values were corrected for multiple testing using the Benjamini–Hochberg false discovery rate (FDR) procedure and significance levels are denoted as *** p-FDR<0.001, ** p-FDR<0.01, * p-FDR<0.05. B, Predicted late-life depression score across levels of the psychological resource (PR) composite. Participants were stratified by low (10th percentile), middle (10–90th percentile), and high (90th percentile) neuroticism PGS. Black arrows mark the difference in predicted scores between the high- and low-PGS groups at the minimum (−4) and maximum (+2) PR composite values. Shaded areas represent 95% confidence intervals. C, Generalized structured component analysis. Path diagram illustrating the moderating effect of neuroticism PGS on the association between the PR component and late-life depression. Path coefficients and component loadings are displayed on the arrows. All estimated paths and loadings were statistically significant, with 95% confidence intervals not including zero.
Research Square preprint v1 (10.21203/rs.3.rs-9990161/v1) · Figure source · CC BY 4.0
Supplementary Figure 1 (part 1 of 8)
Caption & source
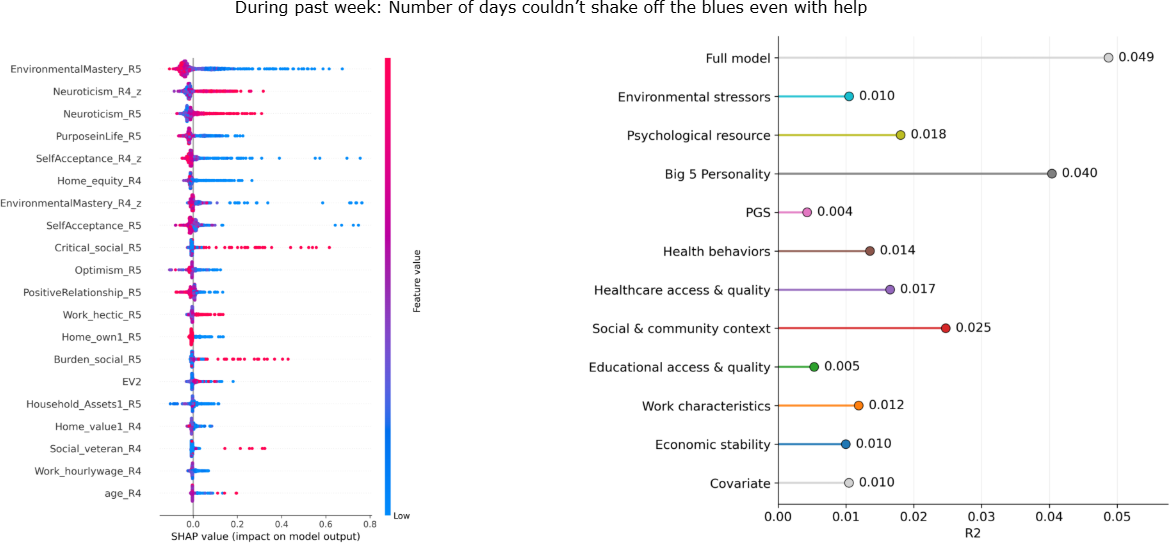
Sensitivity analysis across eight depression-related outcomes. SHAP summary plots (left) and domain-level R² (right) from gradient boosting machine (GBM) models fitted for each outcome. Models were trained using all 426 variables (full model) to derive SHAP values and separately within each domain to estimate domain-specific R². Outcome shown in this part: Days unable to shake off the blues even with help.
Research Square preprint v1, Supplementary Information (10.21203/rs.3.rs-9990161/v1) · Figure source · CC BY 4.0
Supplementary Figure 1 (part 2 of 8)
Caption & source
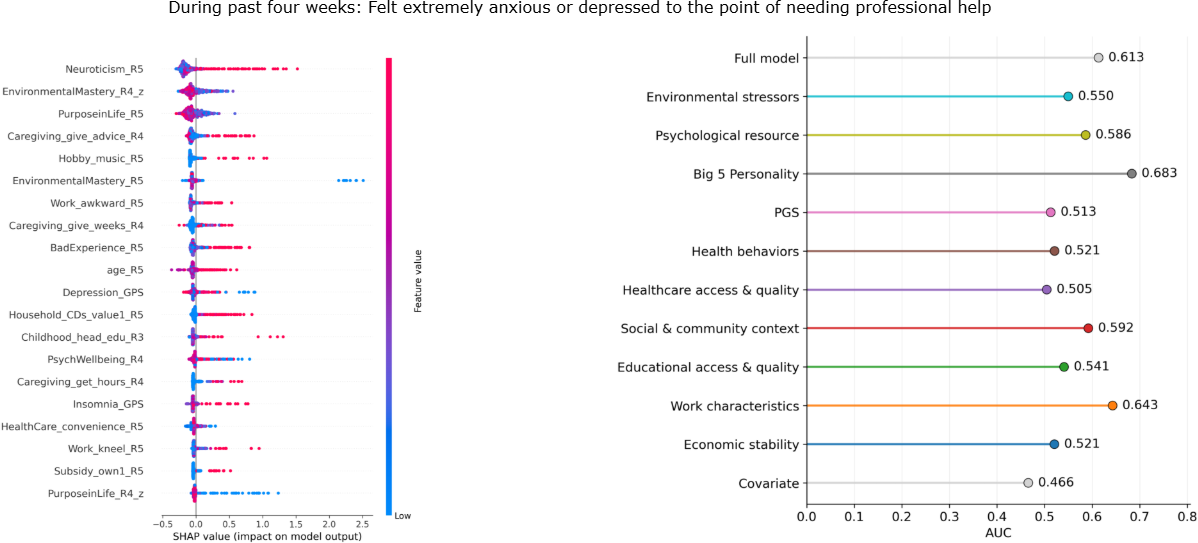
Sensitivity analysis across eight depression-related outcomes. SHAP summary plots (left) and domain-level R² (right) from gradient boosting machine (GBM) models fitted for each outcome. Models were trained using all 426 variables (full model) to derive SHAP values and separately within each domain to estimate domain-specific R². Outcome shown in this part: Anxiety or depression severe enough to need professional help.
Research Square preprint v1, Supplementary Information (10.21203/rs.3.rs-9990161/v1) · Figure source · CC BY 4.0
Supplementary Figure 1 (part 3 of 8)
Caption & source
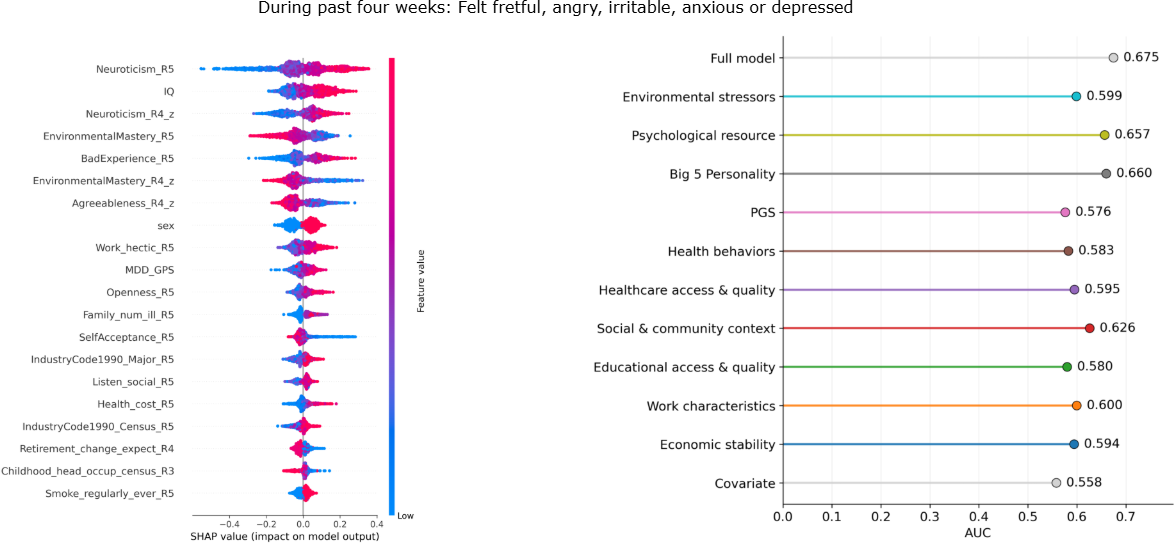
Sensitivity analysis across eight depression-related outcomes. SHAP summary plots (left) and domain-level R² (right) from gradient boosting machine (GBM) models fitted for each outcome. Models were trained using all 426 variables (full model) to derive SHAP values and separately within each domain to estimate domain-specific R². Outcome shown in this part: Feeling fretful, angry, irritable, anxious or depressed.
Research Square preprint v1, Supplementary Information (10.21203/rs.3.rs-9990161/v1) · Figure source · CC BY 4.0
Supplementary Figure 1 (part 4 of 8)
Caption & source
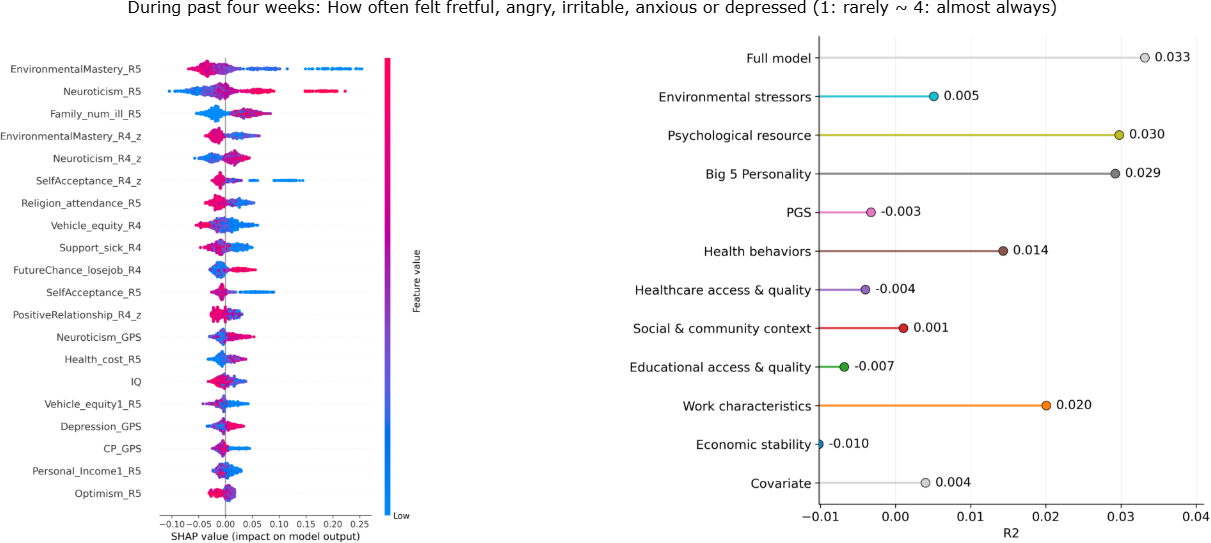
Sensitivity analysis across eight depression-related outcomes. SHAP summary plots (left) and domain-level R² (right) from gradient boosting machine (GBM) models fitted for each outcome. Models were trained using all 426 variables (full model) to derive SHAP values and separately within each domain to estimate domain-specific R². Outcome shown in this part: Frequency of feeling fretful, angry, irritable, anxious or depressed.
Research Square preprint v1, Supplementary Information (10.21203/rs.3.rs-9990161/v1) · Figure source · CC BY 4.0
Supplementary Figure 1 (part 5 of 8)
Caption & source
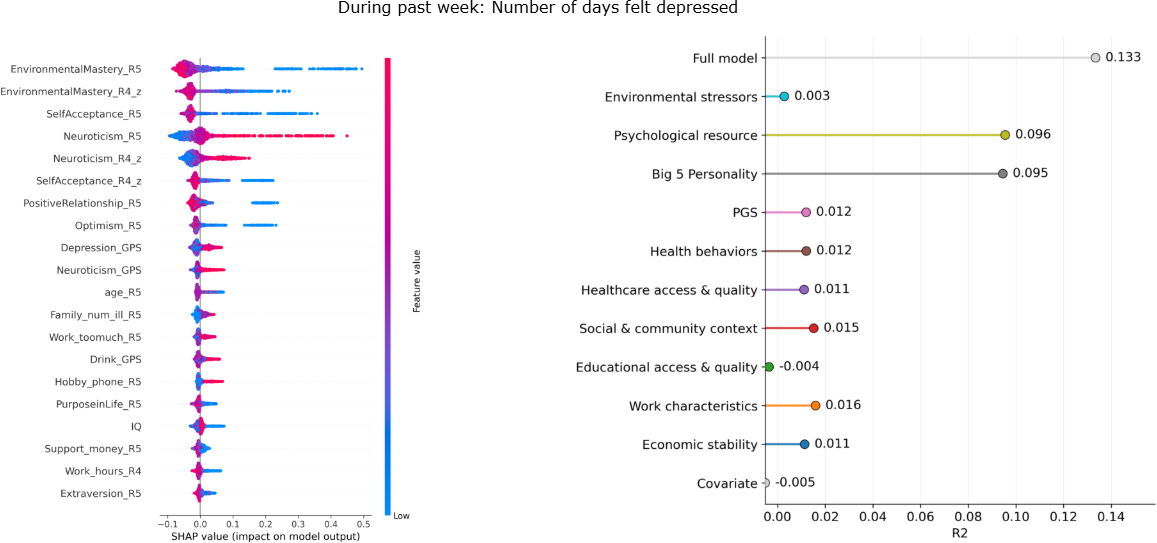
Sensitivity analysis across eight depression-related outcomes. SHAP summary plots (left) and domain-level R² (right) from gradient boosting machine (GBM) models fitted for each outcome. Models were trained using all 426 variables (full model) to derive SHAP values and separately within each domain to estimate domain-specific R². Outcome shown in this part: Number of days feeling depressed.
Research Square preprint v1, Supplementary Information (10.21203/rs.3.rs-9990161/v1) · Figure source · CC BY 4.0
Supplementary Figure 1 (part 6 of 8)
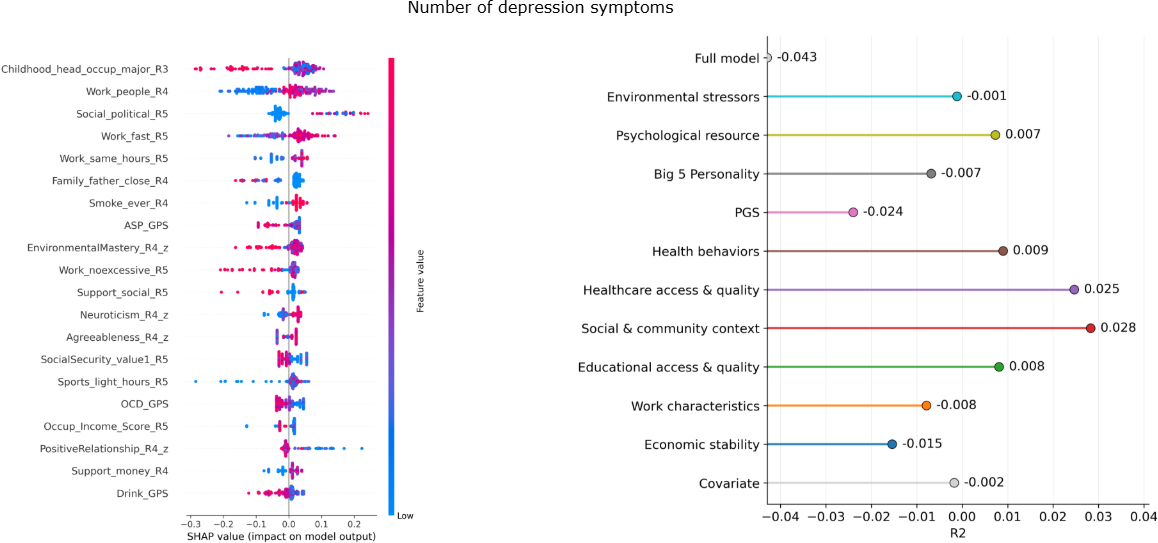
Caption & source
Sensitivity analysis across eight depression-related outcomes. SHAP summary plots (left) and domain-level R² (right) from gradient boosting machine (GBM) models fitted for each outcome. Models were trained using all 426 variables (full model) to derive SHAP values and separately within each domain to estimate domain-specific R². Outcome shown in this part: Number of depression symptoms.
Research Square preprint v1, Supplementary Information (10.21203/rs.3.rs-9990161/v1) · Figure source · CC BY 4.0
Supplementary Figure 1 (part 7 of 8)
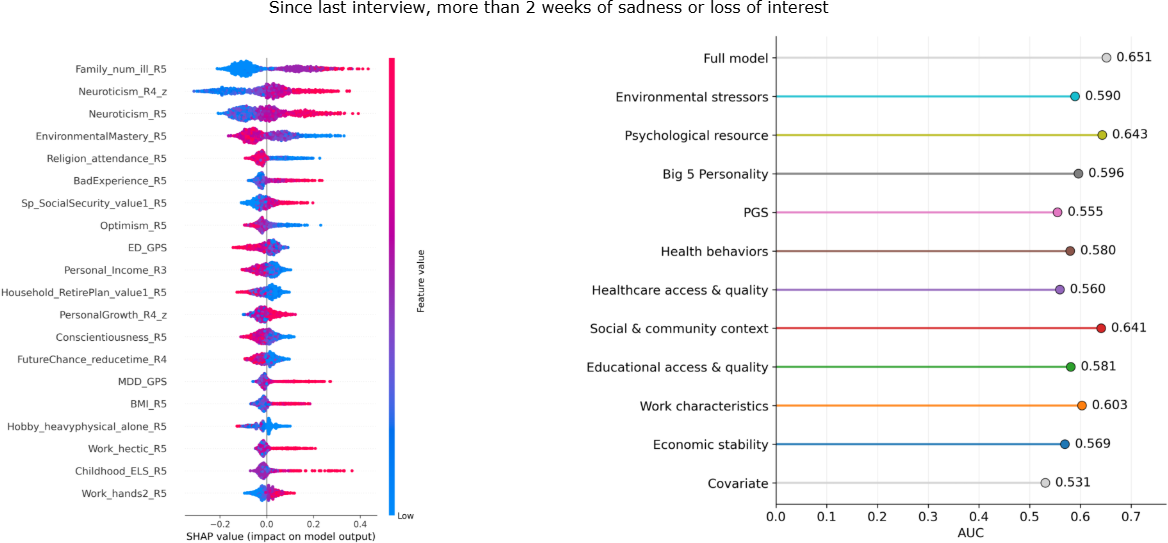
Caption & source
Sensitivity analysis across eight depression-related outcomes. SHAP summary plots (left) and domain-level R² (right) from gradient boosting machine (GBM) models fitted for each outcome. Models were trained using all 426 variables (full model) to derive SHAP values and separately within each domain to estimate domain-specific R². Outcome shown in this part: More than two weeks of sadness or loss of interest.
Research Square preprint v1, Supplementary Information (10.21203/rs.3.rs-9990161/v1) · Figure source · CC BY 4.0
Supplementary Figure 1 (part 8 of 8)
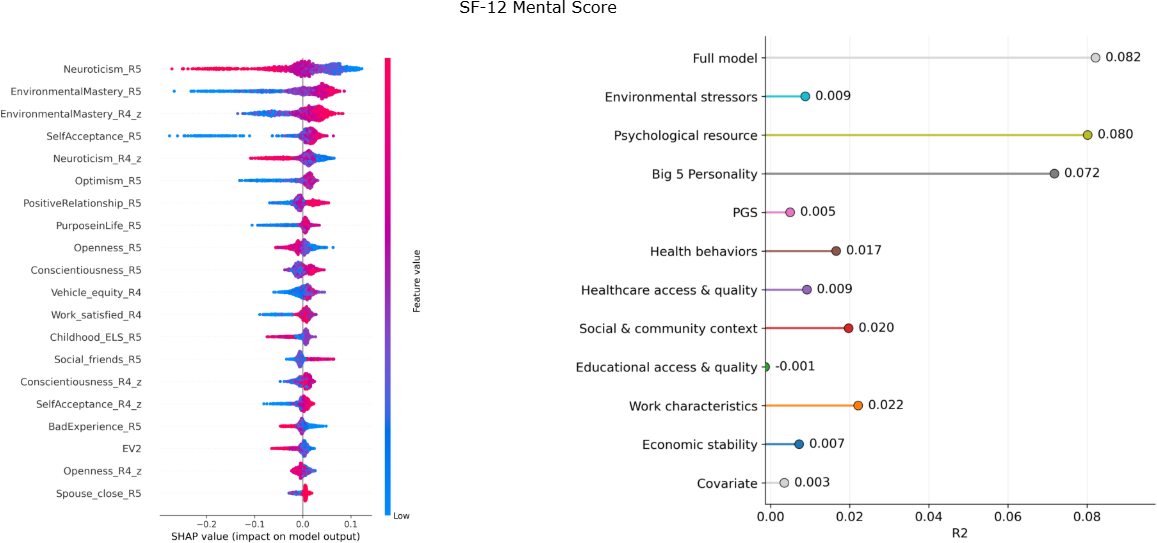
Caption & source
Sensitivity analysis across eight depression-related outcomes. SHAP summary plots (left) and domain-level R² (right) from gradient boosting machine (GBM) models fitted for each outcome. Models were trained using all 426 variables (full model) to derive SHAP values and separately within each domain to estimate domain-specific R². Outcome shown in this part: SF-12 mental score.
Research Square preprint v1, Supplementary Information (10.21203/rs.3.rs-9990161/v1) · Figure source · CC BY 4.0
Supplementary Figure 2
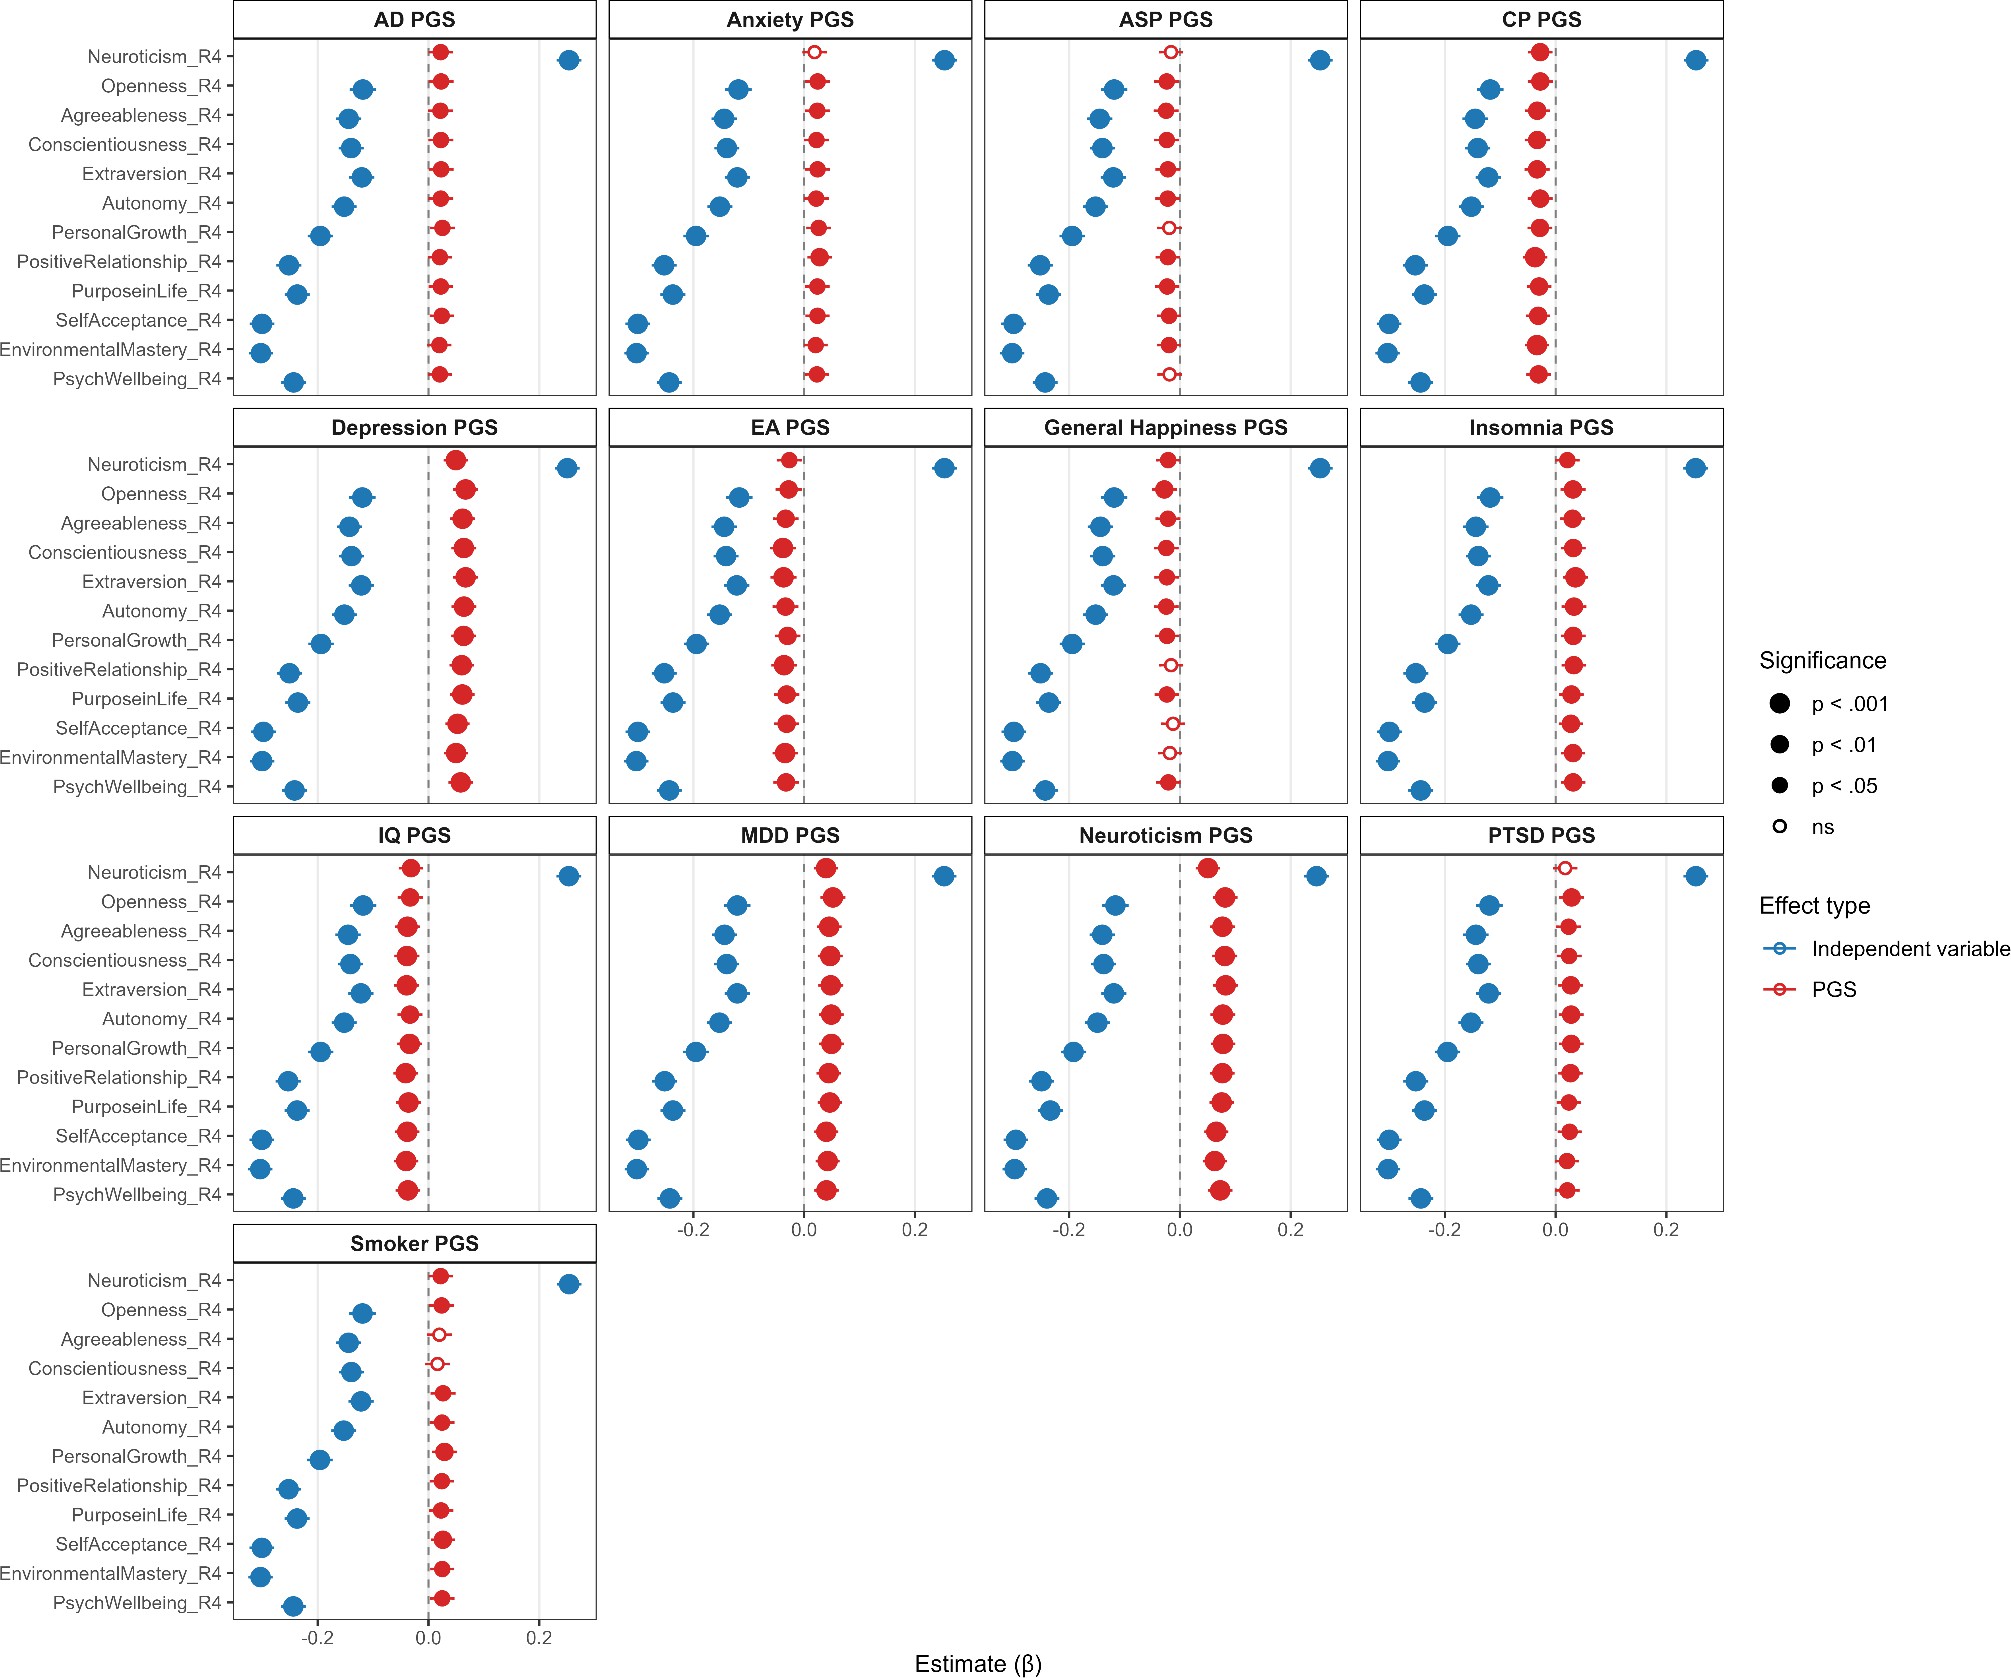
Caption & source
Additive associations of polygenic scores and wave 4 key variables with late-life depressive symptoms. Standardized regression coefficients (β) are shown for key independent variables (blue) and polygenic scores (PGS; red) from models including both sets of predictors simultaneously. Points indicate effect estimates and error bars denote 95% confidence intervals. Filled points indicate statistical significance (p < 0.05), with gradation in size reflecting p-value thresholds as indicated. AD, alcohol dependence; ASP, automobile speeding propensity; CP, cognitive performance; EA, educational attainment; MDD, major depressive disorder; PTSD, post-traumatic stress disorder.
Research Square preprint v1, Supplementary Information (10.21203/rs.3.rs-9990161/v1) · Figure source · CC BY 4.0
Supplementary Figure 3
Caption & source
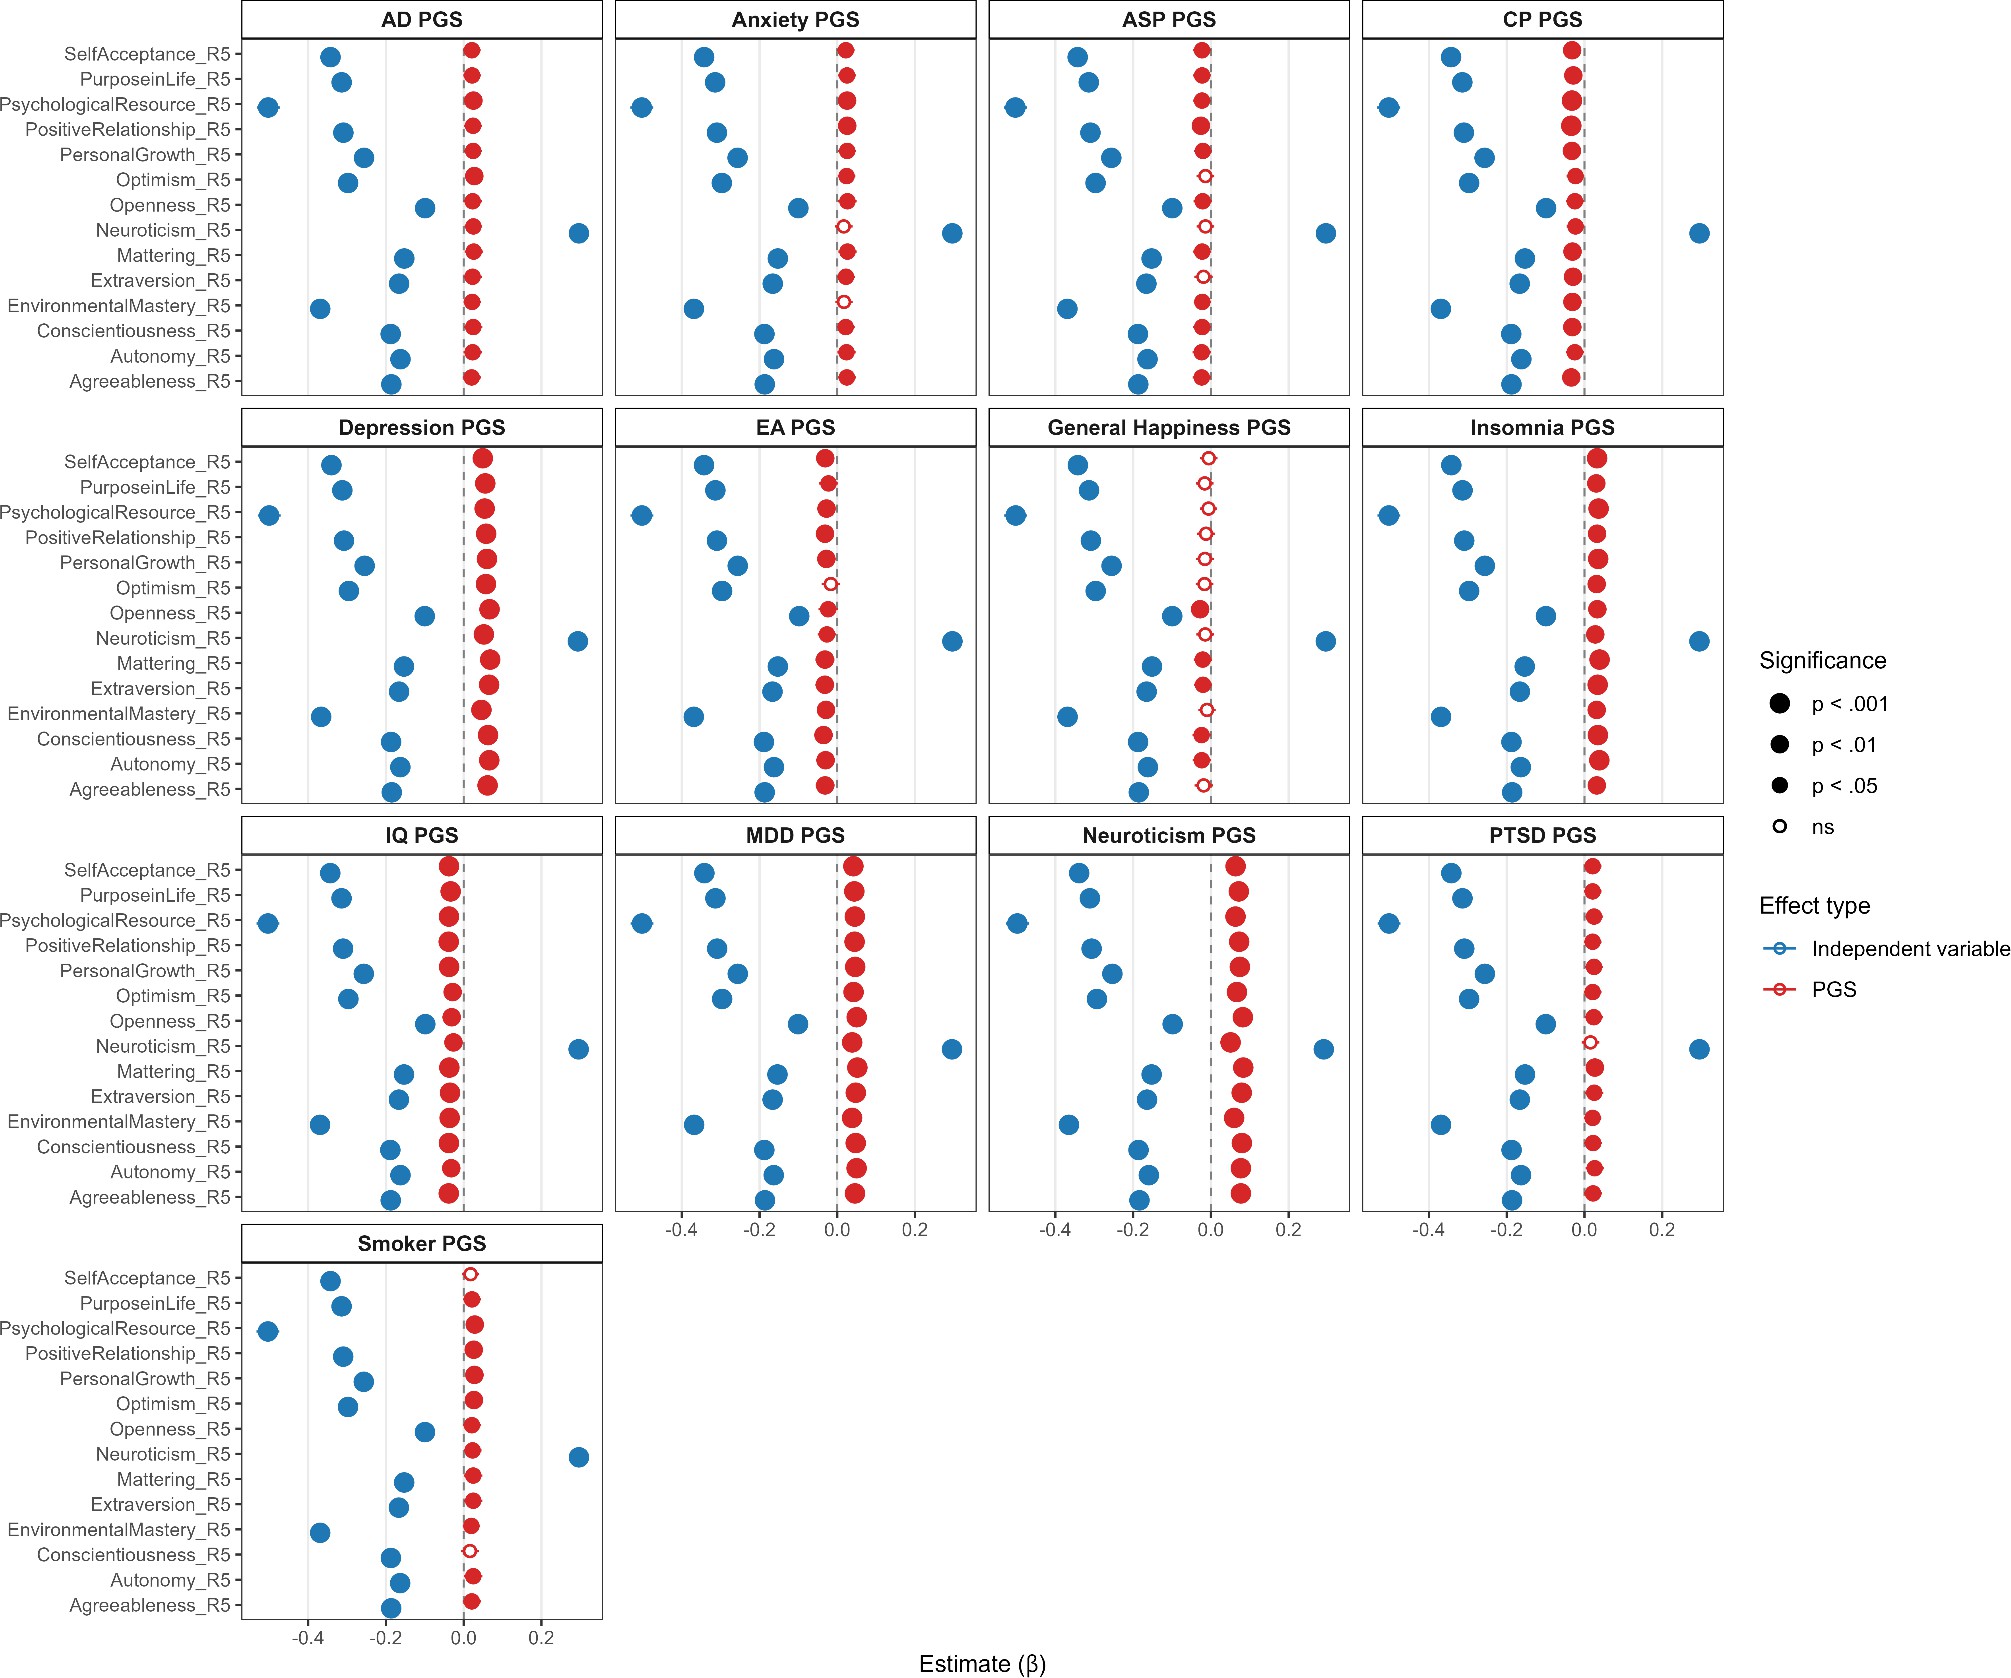
Additive associations of polygenic scores and wave 5 key variables with late-life depressive symptoms. Standardized regression coefficients (β) are shown for key independent variables (blue) and polygenic scores (PGS; red) from models including both sets of predictors simultaneously. Points indicate effect estimates and error bars denote 95% confidence intervals. Filled points indicate statistical significance (p < 0.05), with gradation in size reflecting p-value thresholds. AD, alcohol dependence; ASP, automobile speeding propensity; CP, cognitive performance; EA, educational attainment; MDD, major depressive disorder; PTSD, post-traumatic stress disorder.
Research Square preprint v1, Supplementary Information (10.21203/rs.3.rs-9990161/v1) · Figure source · CC BY 4.0
Supplementary Figure 4
Caption & source
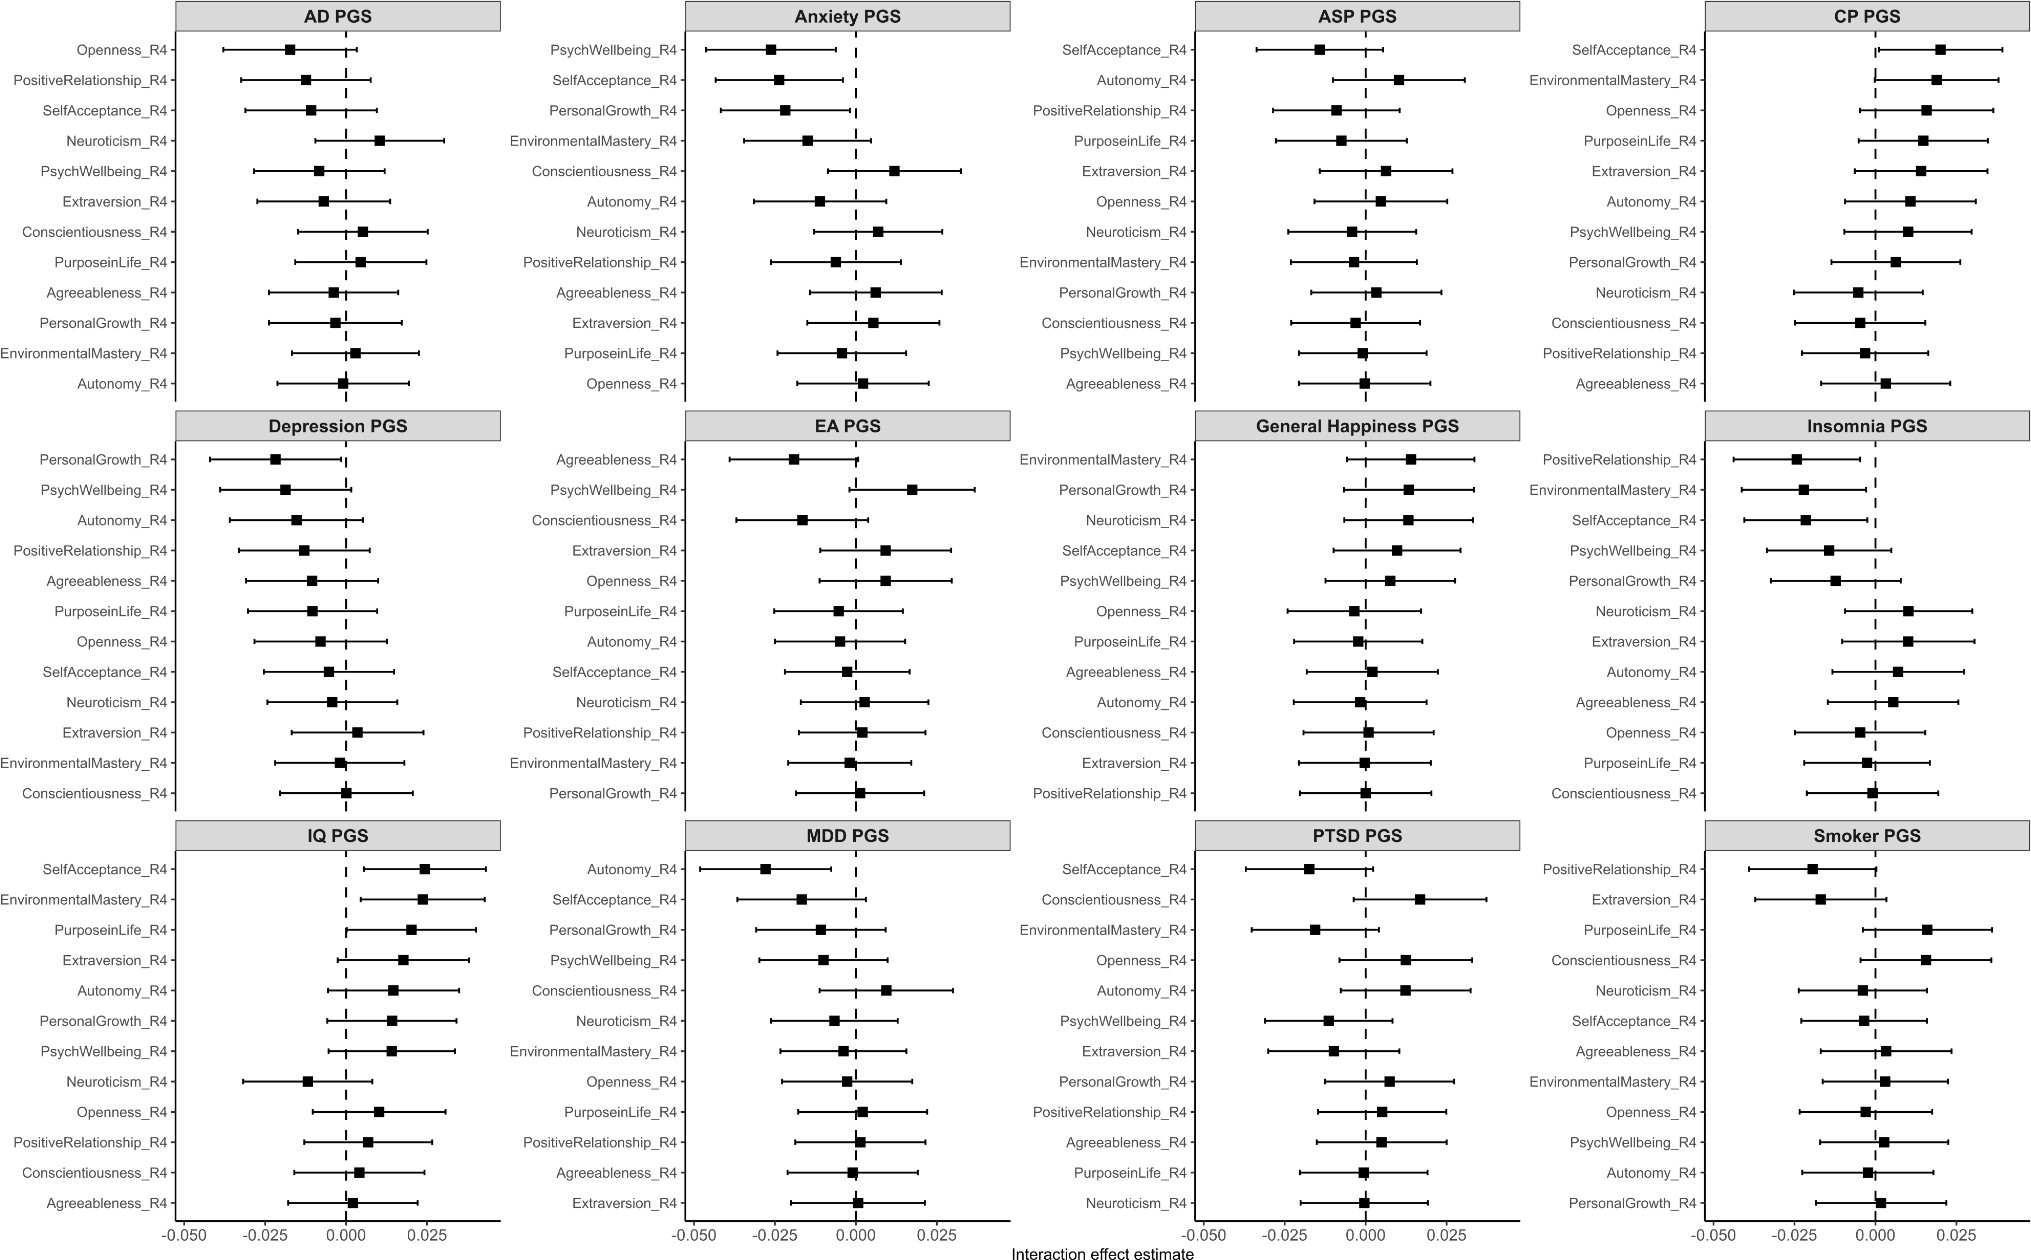
Forest plot of interaction effects between neuroticism PGS and key variables (wave 4). Points represent standardized regression coefficients (β) for the interaction terms, and horizontal bars denote 95% confidence intervals. P values were corrected for multiple testing using the Benjamini–Hochberg false discovery rate (FDR) procedure; no interaction effects survived FDR correction. Significance levels are denoted as *** p-FDR<0.001, ** p-FDR<0.01, * p-FDR<0.05. AD, alcohol dependence; ASP, automobile speeding propensity; CP, cognitive performance; EA, educational attainment; MDD, major depressive disorder; PTSD, post-traumatic stress disorder.
Research Square preprint v1, Supplementary Information (10.21203/rs.3.rs-9990161/v1) · Figure source · CC BY 4.0
Supplementary Figure 5
Caption & source
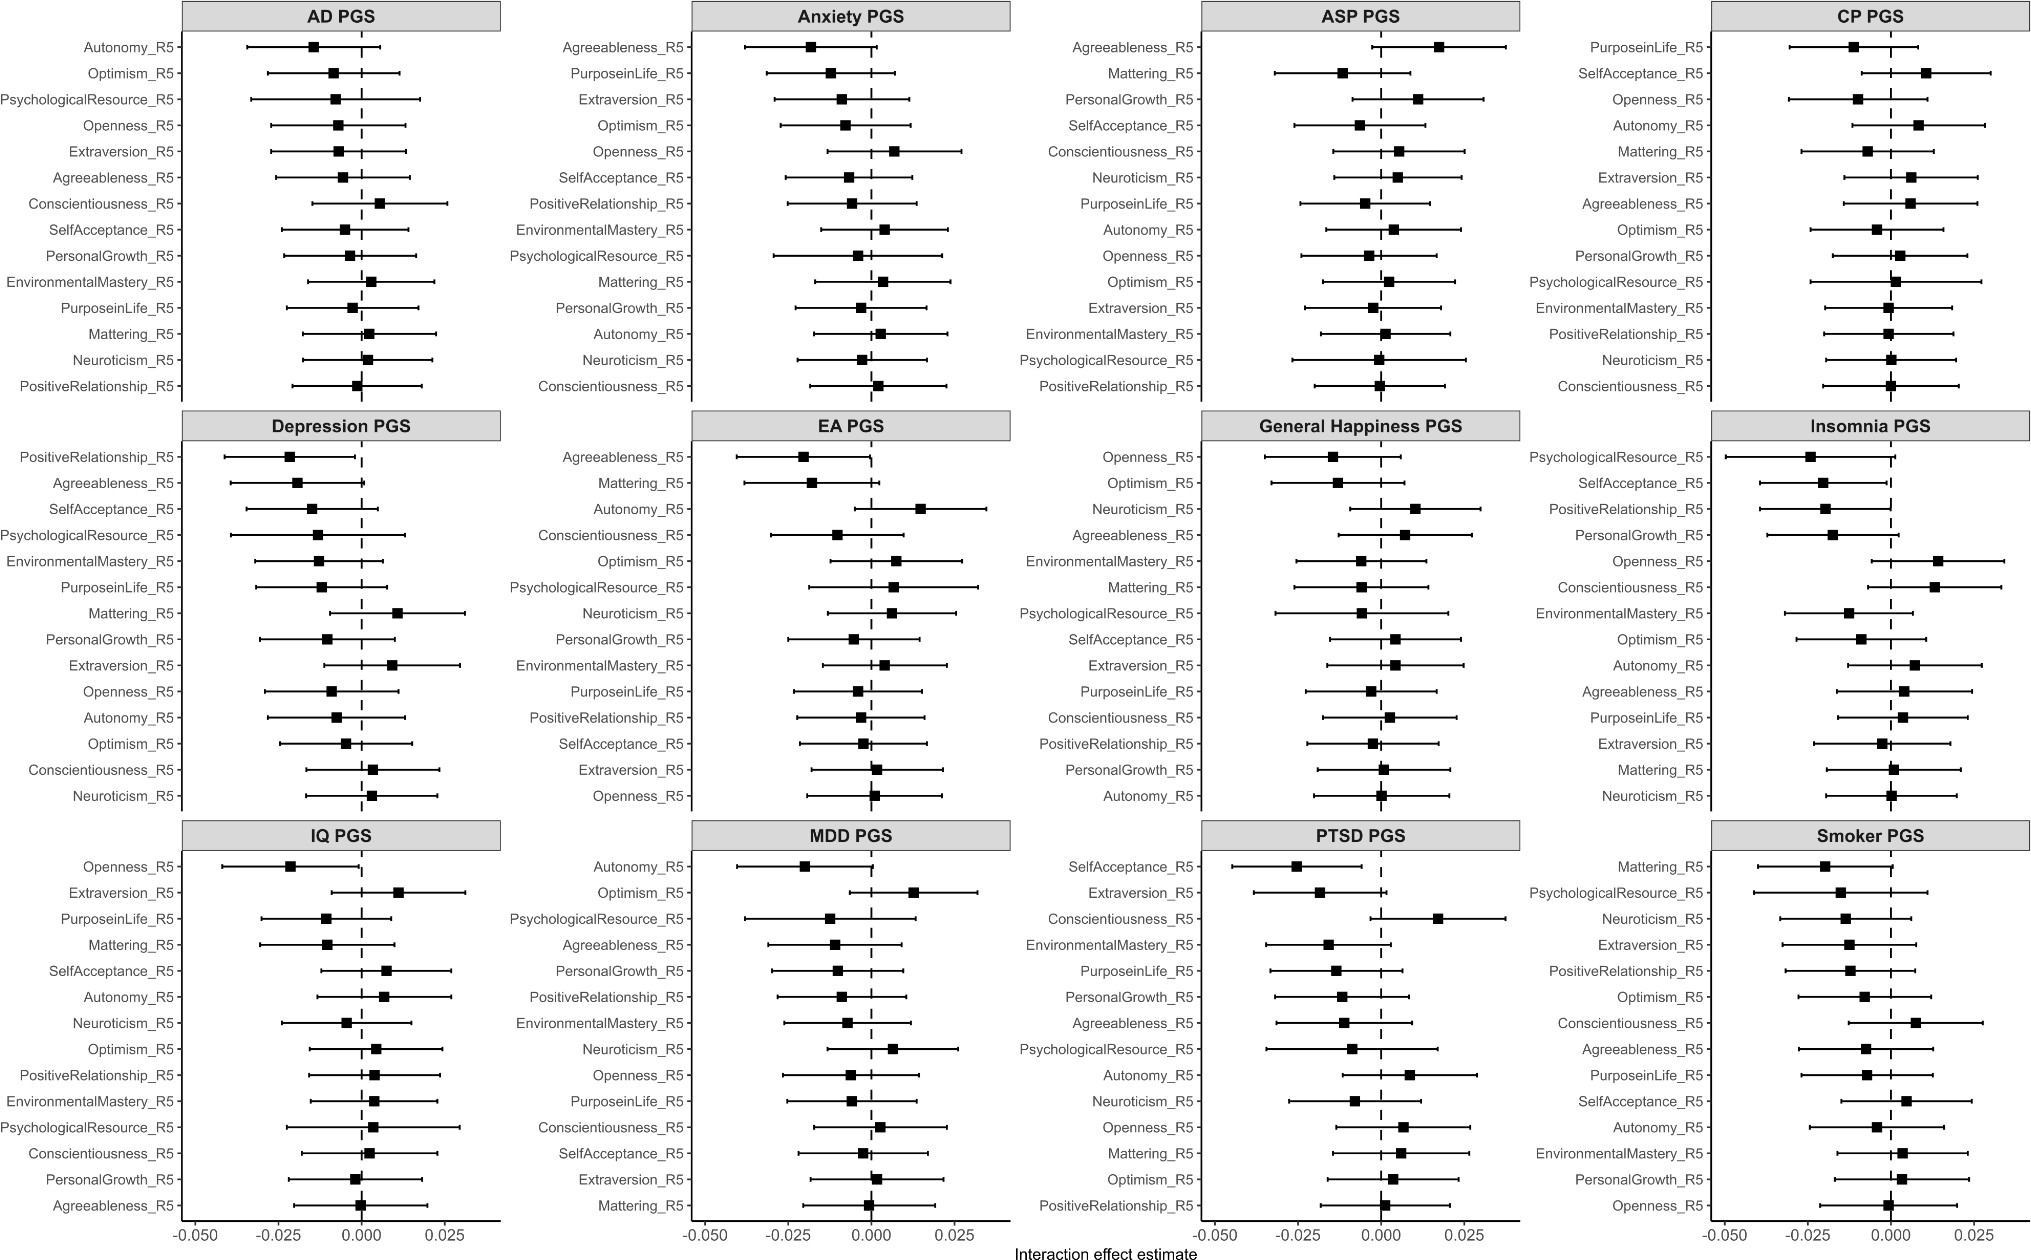
Forest plot of interaction effects between neuroticism PGS and key variables (wave 5). Points represent standardized regression coefficients (β) for the interaction terms, and horizontal bars denote 95% confidence intervals. P values were corrected for multiple testing using the Benjamini–Hochberg false discovery rate (FDR) procedure; no interaction effects survived FDR correction. Significance levels are denoted as *** p-FDR<0.001, ** p-FDR<0.01, * p-FDR<0.05. AD, alcohol dependence; ASP, automobile speeding propensity; CP, cognitive performance; EA, educational attainment; MDD, major depressive disorder; PTSD, post-traumatic stress disorder.
Research Square preprint v1, Supplementary Information (10.21203/rs.3.rs-9990161/v1) · Figure source · CC BY 4.0
Supplementary Figure 6
Caption & source
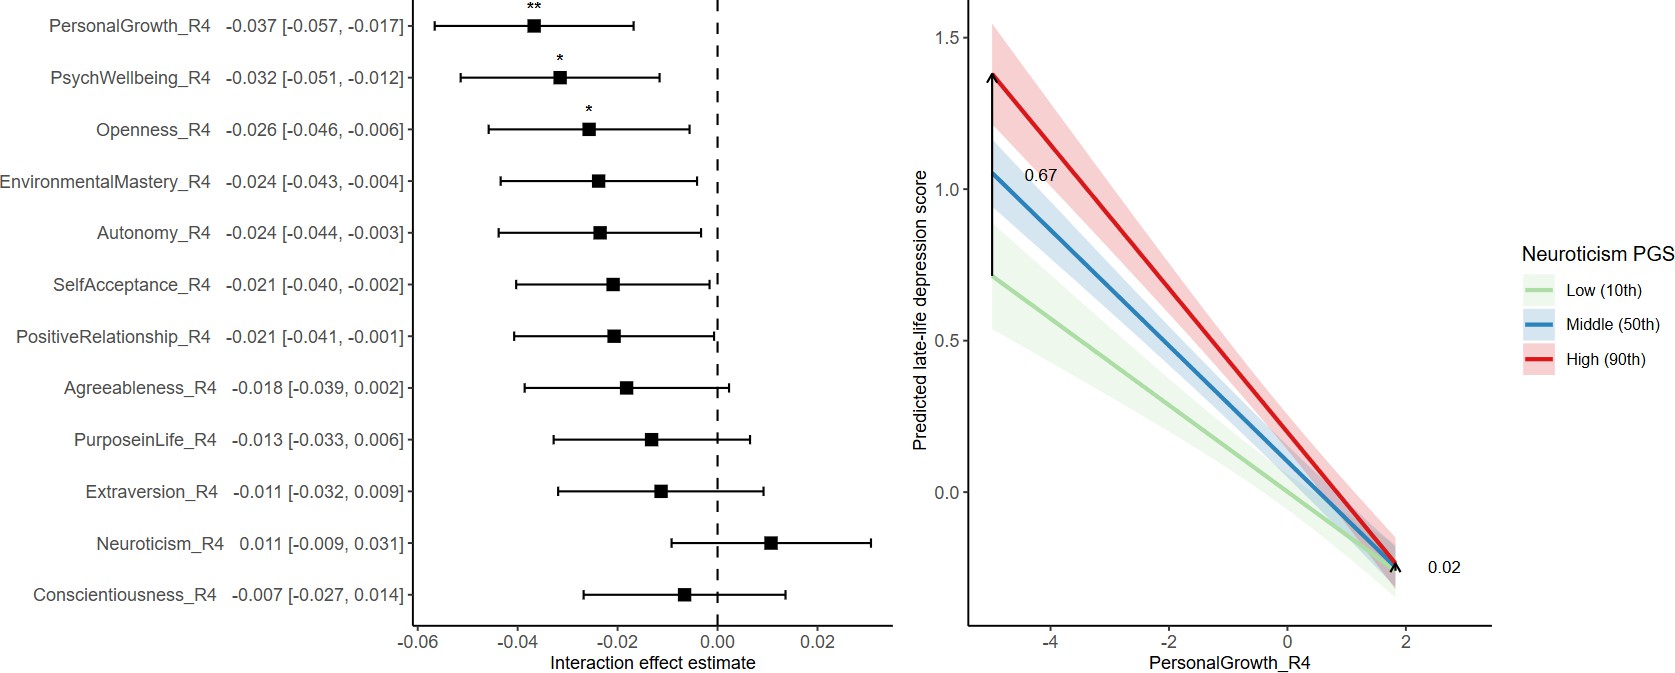
Interaction between neuroticism PGS and key variables (wave 4). Forest plot (left) of interaction effects between neuroticism PGS and key variables, and interaction plot (right) illustrating predicted late-life depressive symptoms across levels of personal growth. Participants were stratified by low (10th), middle (10–90th), and high (90th) percentiles of neuroticism PGS. Black arrows mark the difference in predicted scores between the high- and low-PGS groups at the minimum and maximum personal growth values. Shaded areas represent 95% confidence intervals. *** p-FDR<0.001, ** p-FDR<0.01, * p-FDR<0.05.
Research Square preprint v1, Supplementary Information (10.21203/rs.3.rs-9990161/v1) · Figure source · CC BY 4.0
Versions & resources
Research Square public preprint, version 1
Posted 2026-06-17
Cite this work
Yoonjung Joo, Chaeyoon Shin, Junghoon Park, Jiook Cha, Gyeongcheol Cho, & Jong Hyun Jung (2026). Psychological resources confer greatest protection against late-life depression in genetically vulnerable adults. Preprint. https://doi.org/10.21203/rs.3.rs-9990161/v1