
2020 · Sustainability · 12(20), 8496
Journal DOI: 10.3390/su12208496 Open access
Abstract
Owing to its potentially far-reaching impact on a large population, an educational policy may lead to unintended consequences beyond the educational area. The High School Equalization Policy (HSEP), introduced into South Korea in the mid-1970s, is representative of such a policy. HSEP prohibits high school entrance exams and randomly assigns students to a high school near their residence. Despite its aim of ensuring equal opportunities in education for all students regardless of socio-economic status, a frequent criticism was that HSEP could prompt students’ families to move to a region near traditional elite high schools, which, in turn, would widen the gap in house prices between different regions. Thus, we conducted an empirical study to examine the secondary influence of the HSEP on the housing market via a difference-in-differences (DD) analysis. We used house price data from the Gangwon province, as the partial introduction of HSEP into the province allowed for a quasi-experimental study on the effect of HSEP. The result revealed that, contrary to expectations, the HSEP in Gangwon had the opposite spillover effect of reducing the gap of the average house prices by 5%~9% across regions.
Version of record · Abstract source · CC BY 4.0
Figures 2 images
Select an image to view it at full size. Captions identify the source and version.
Figure 1
Caption & source
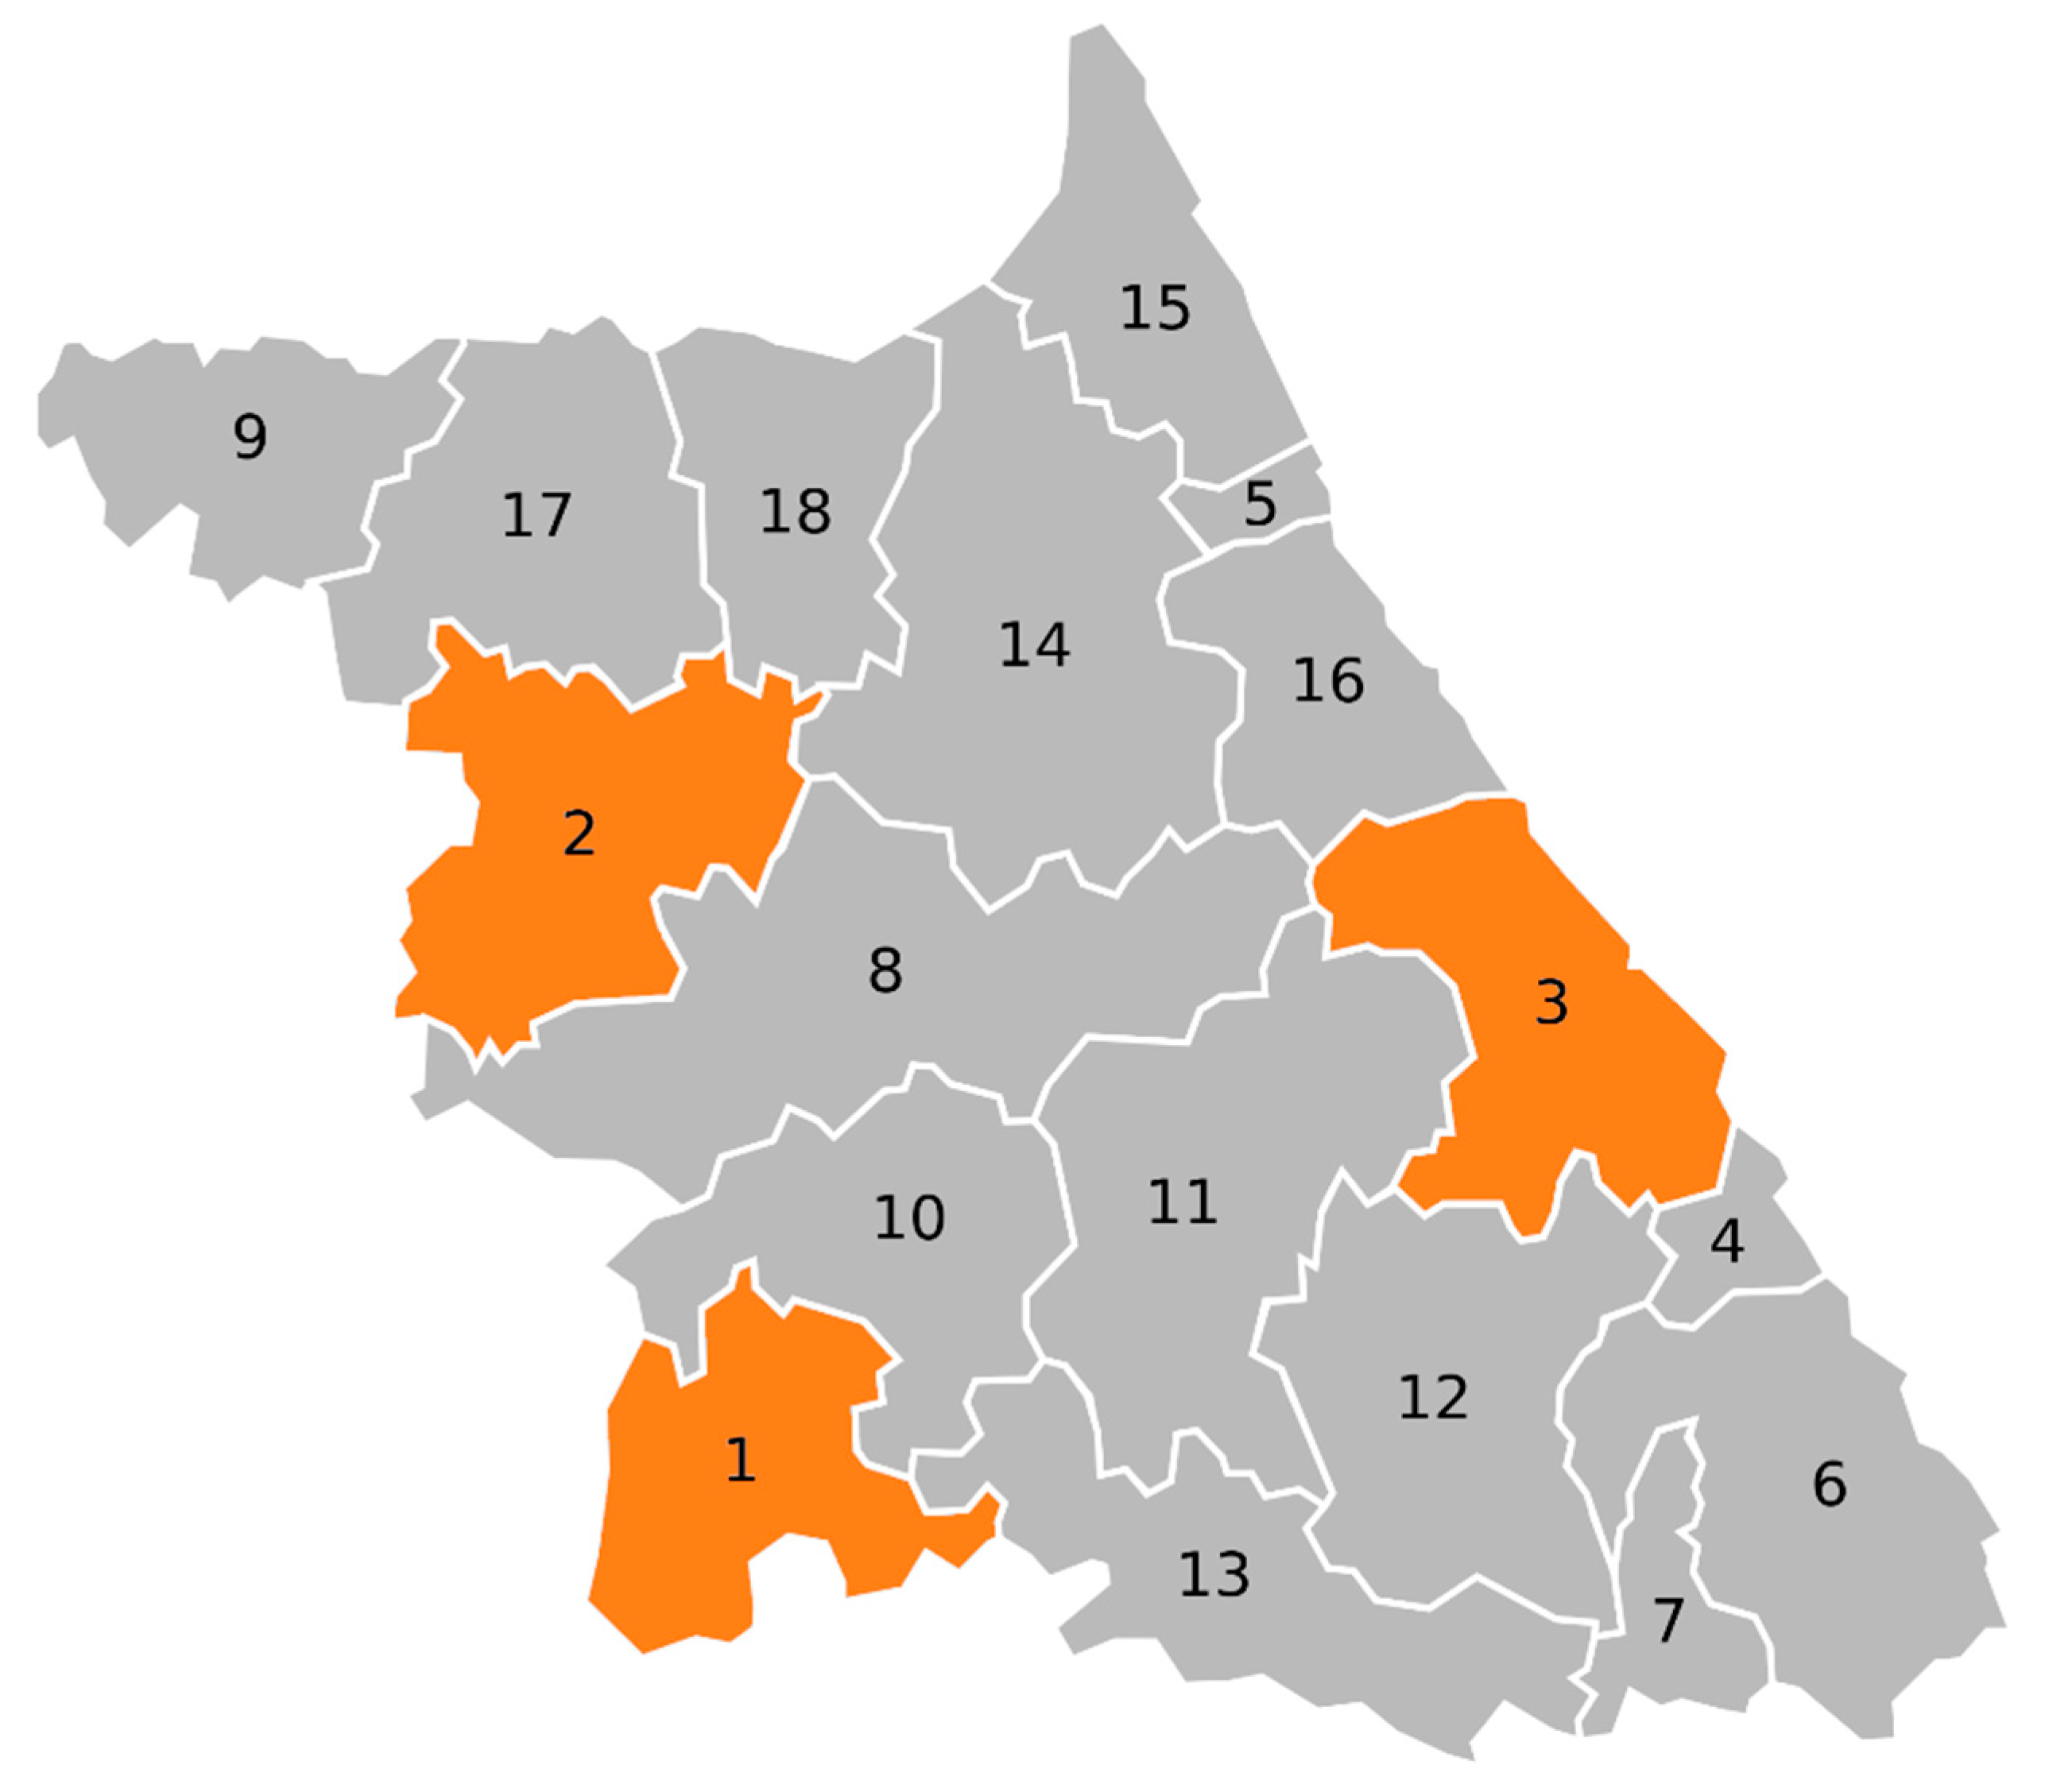
A map of the administrative districts in Gangwon province. Note: Each block with a number represents an administrative district (1 = Wonju, 2 = Chuncheon, 3 = Gangneung, 4 = Donghaey 5 = Sokcho, 6 = Samcheok, 7 = Taebaek, 8 = Hongcheon, 9 = Cherwony 10 = Hoengseongy 11 = Pyeongchang, 12 = Jeongseon, 13 = Yeongwol, 14 = Inje, 15 = Goseong, 16 = Yangyang, 17 = Hwacheon, and 18 = Yanggu). The three districts in the treatment group (HSEP was implemented) are orange-colored, whereas the rest in the control group (HSEP was not implemented) are in gray [30]
Version of record · Figure source · CC BY 4.0
Cho, Choi, and Kim (2020), Figure 1. Base map adapted from ASDFGH, Gangwon Municipal.svg (2012), CC BY-SA 3.0; treatment regions colored by the article authors. Reproduced without further modification.

Figure 2
Caption & source
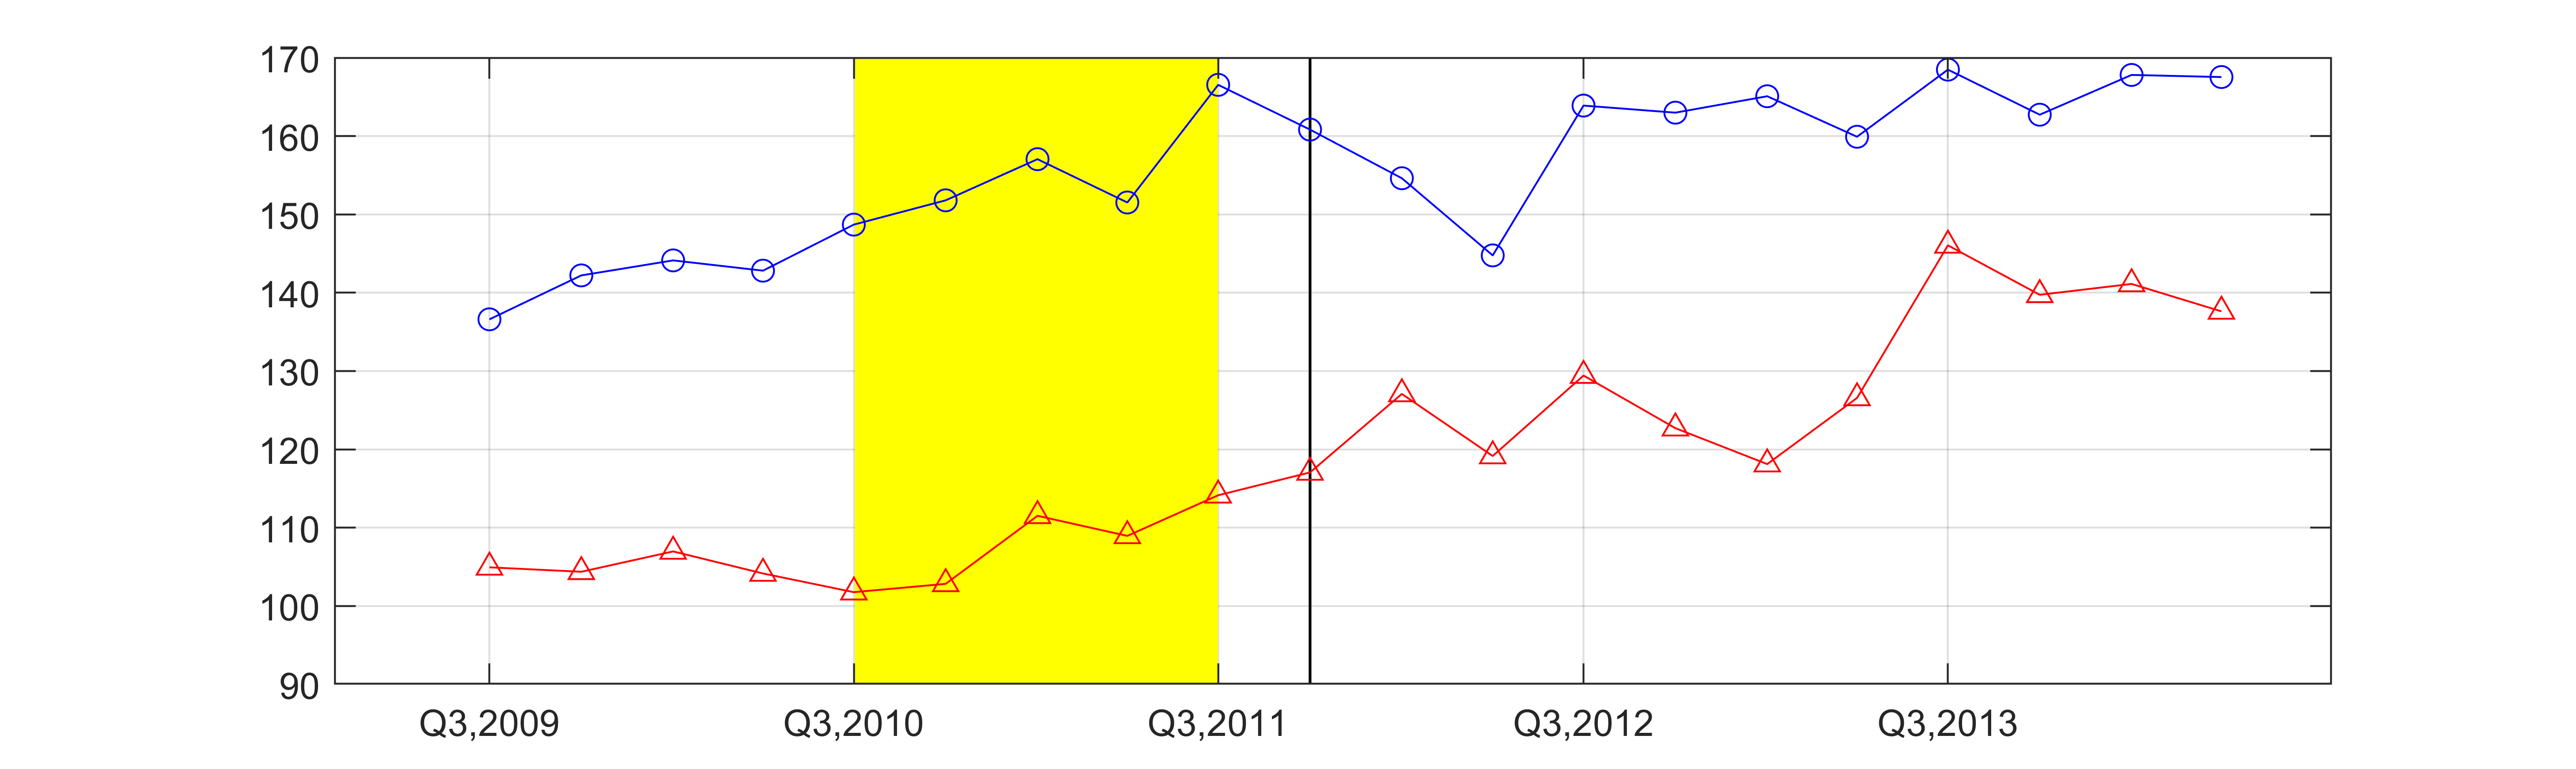
The average house price trends of the treatment and control groups. Note: The X-axis represents the time periods, whereas the Y-axis represents the average house price. The actual transacted price of an apartment per square meter (KRW 10,000) was used for an individual house price. The blue line marked with O denotes the average price trend of the treatment group, while the red line marked with Δ denotes that of the control group. The black vertical line shows the period when the implementation of the High School Equalization Policy (HSEP) was finally determined and announced. The parallel trends assumption was checked based mainly on the periods on the yellow background.
Version of record · Figure source · CC BY 4.0
Versions & resources
Peer-reviewed journal article
Sustainability · 2020
DOI: 10.3390/su12208496Cite this work
Cho, G., Choi, Y., & Kim, J.-H. (2020). Investigating the unintended consequences of the high school equalization policy on the housing market. Sustainability, 12(20), 8496. https://doi.org/10.3390/su12208496